I Analyzed 10 years of Toronto Island ferry ticket data across daily, monthly, seasonal, and 3-hour intervals, integrating weather variables (temperature and precipitation), calendar features (weekends, holidays), and applied forecasting model Prophet to project demand into 2030.
Insights
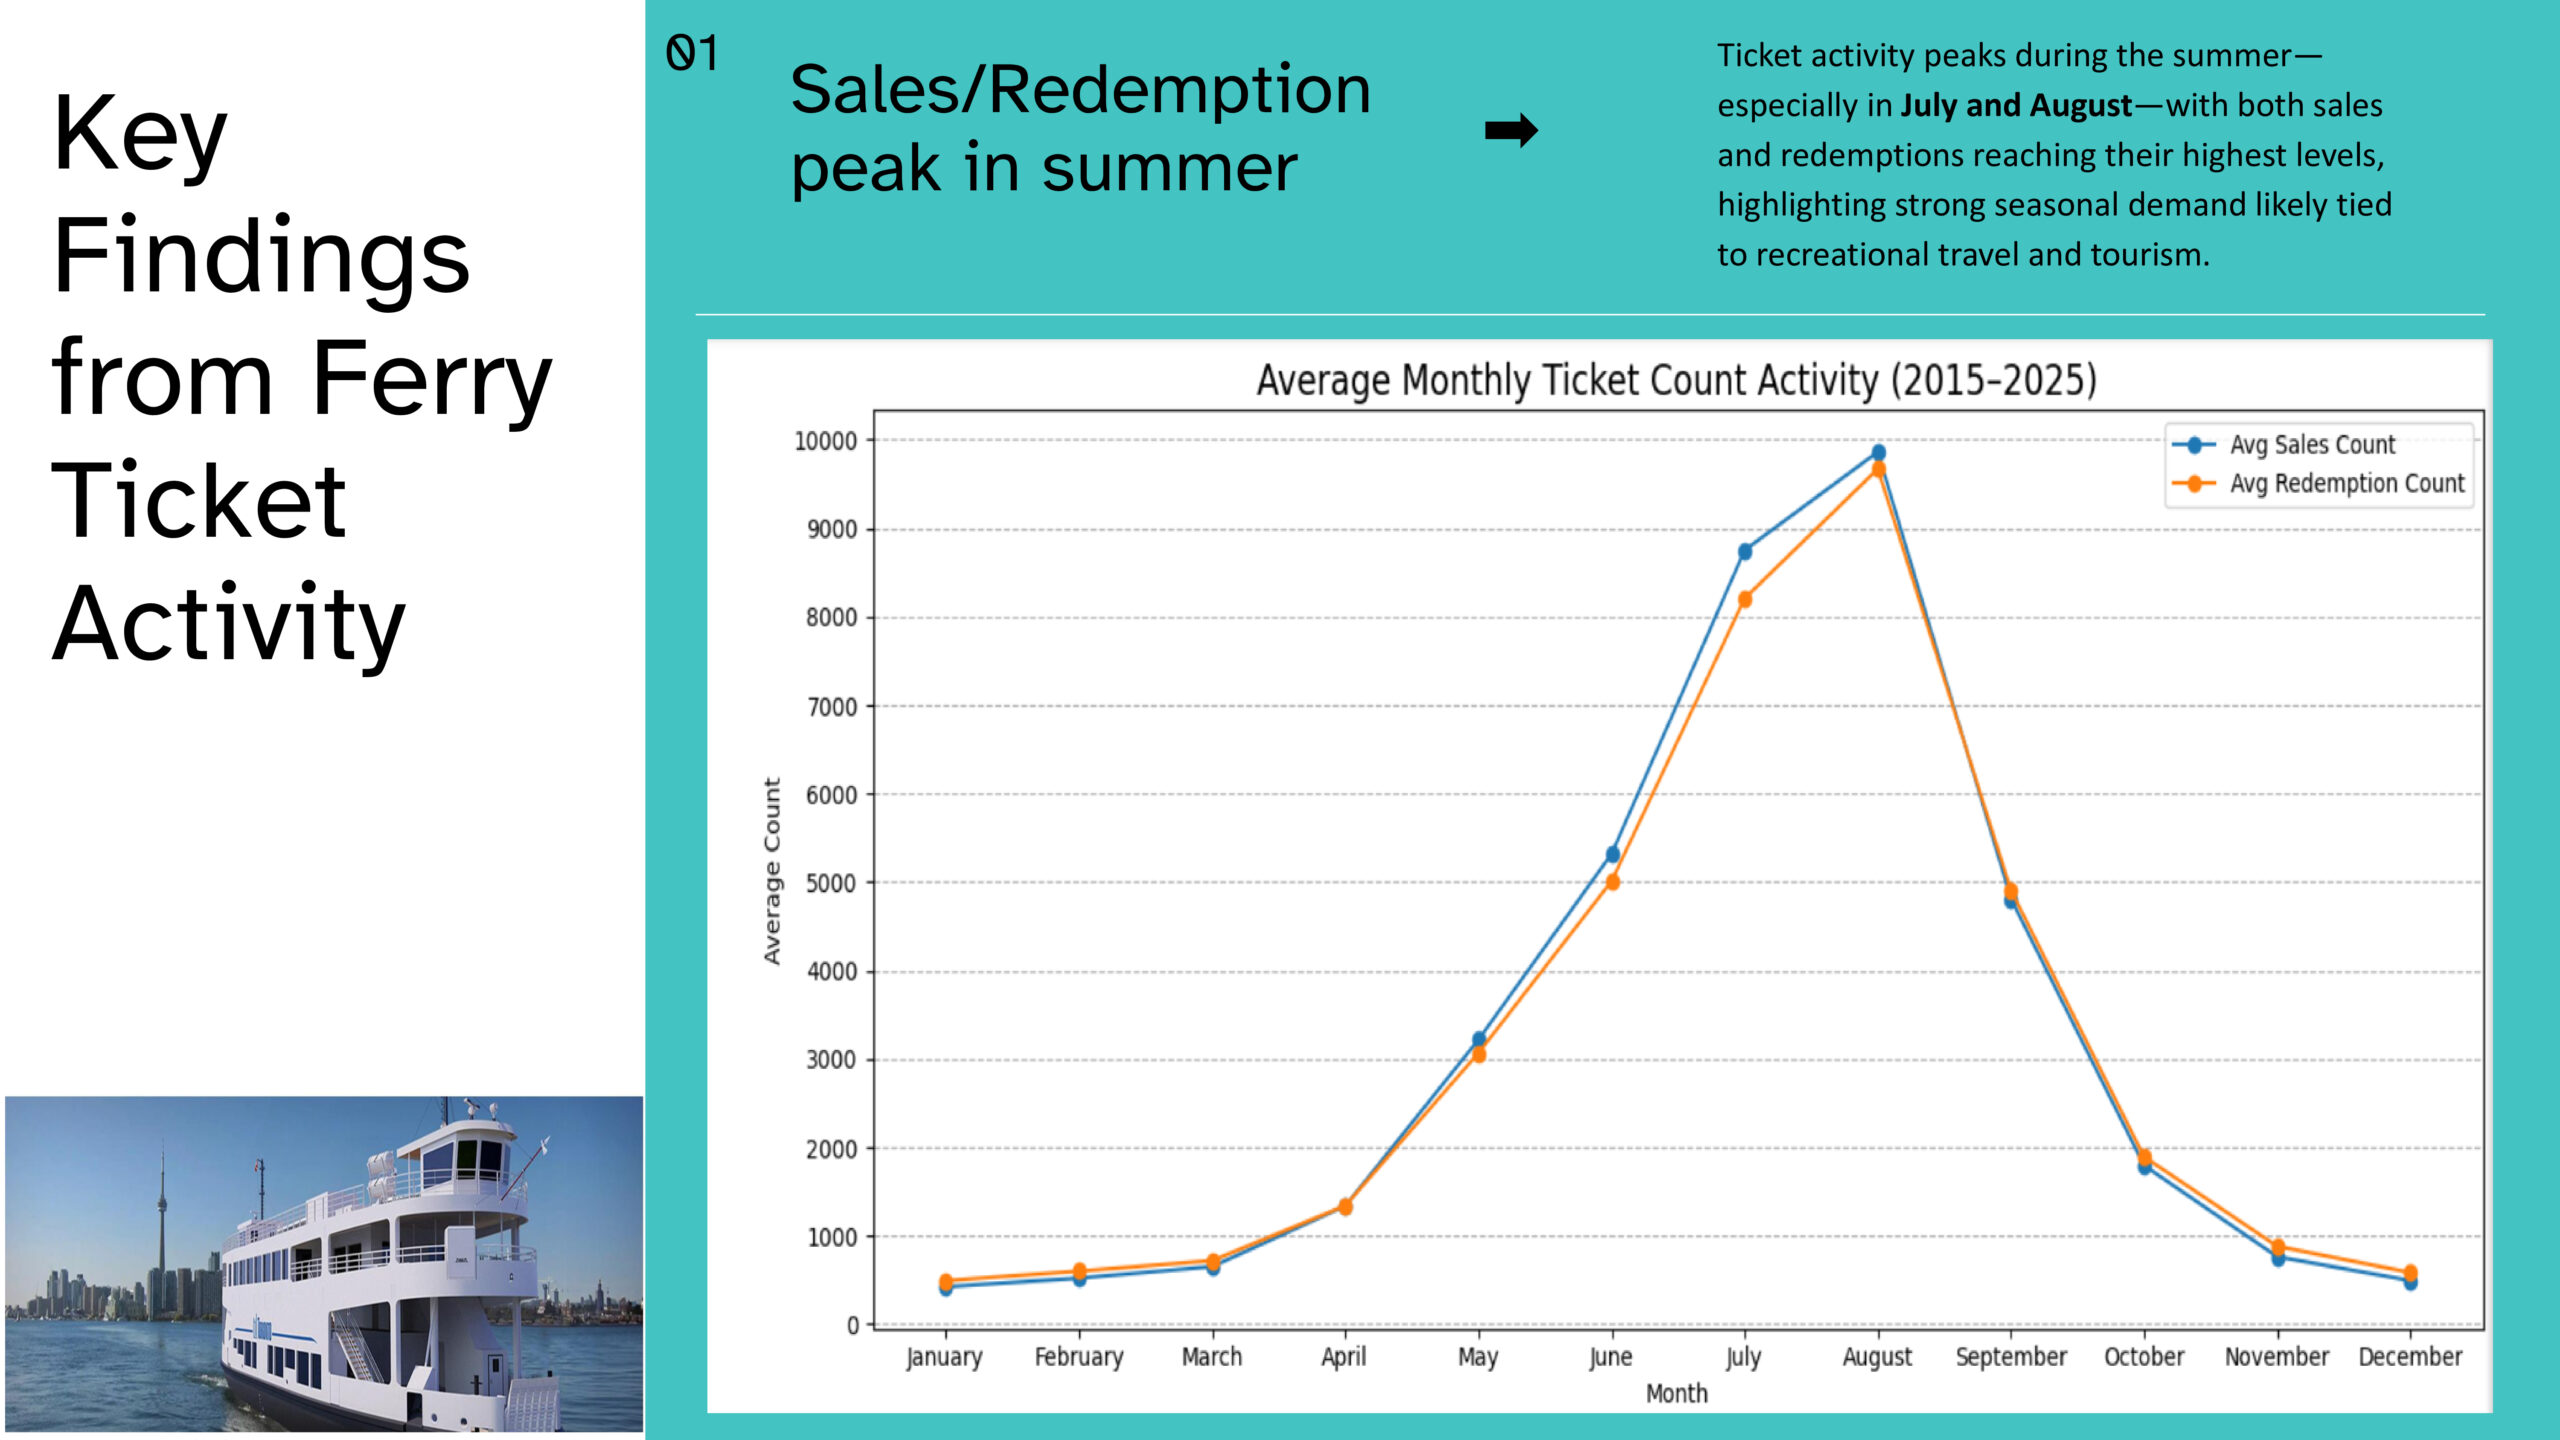
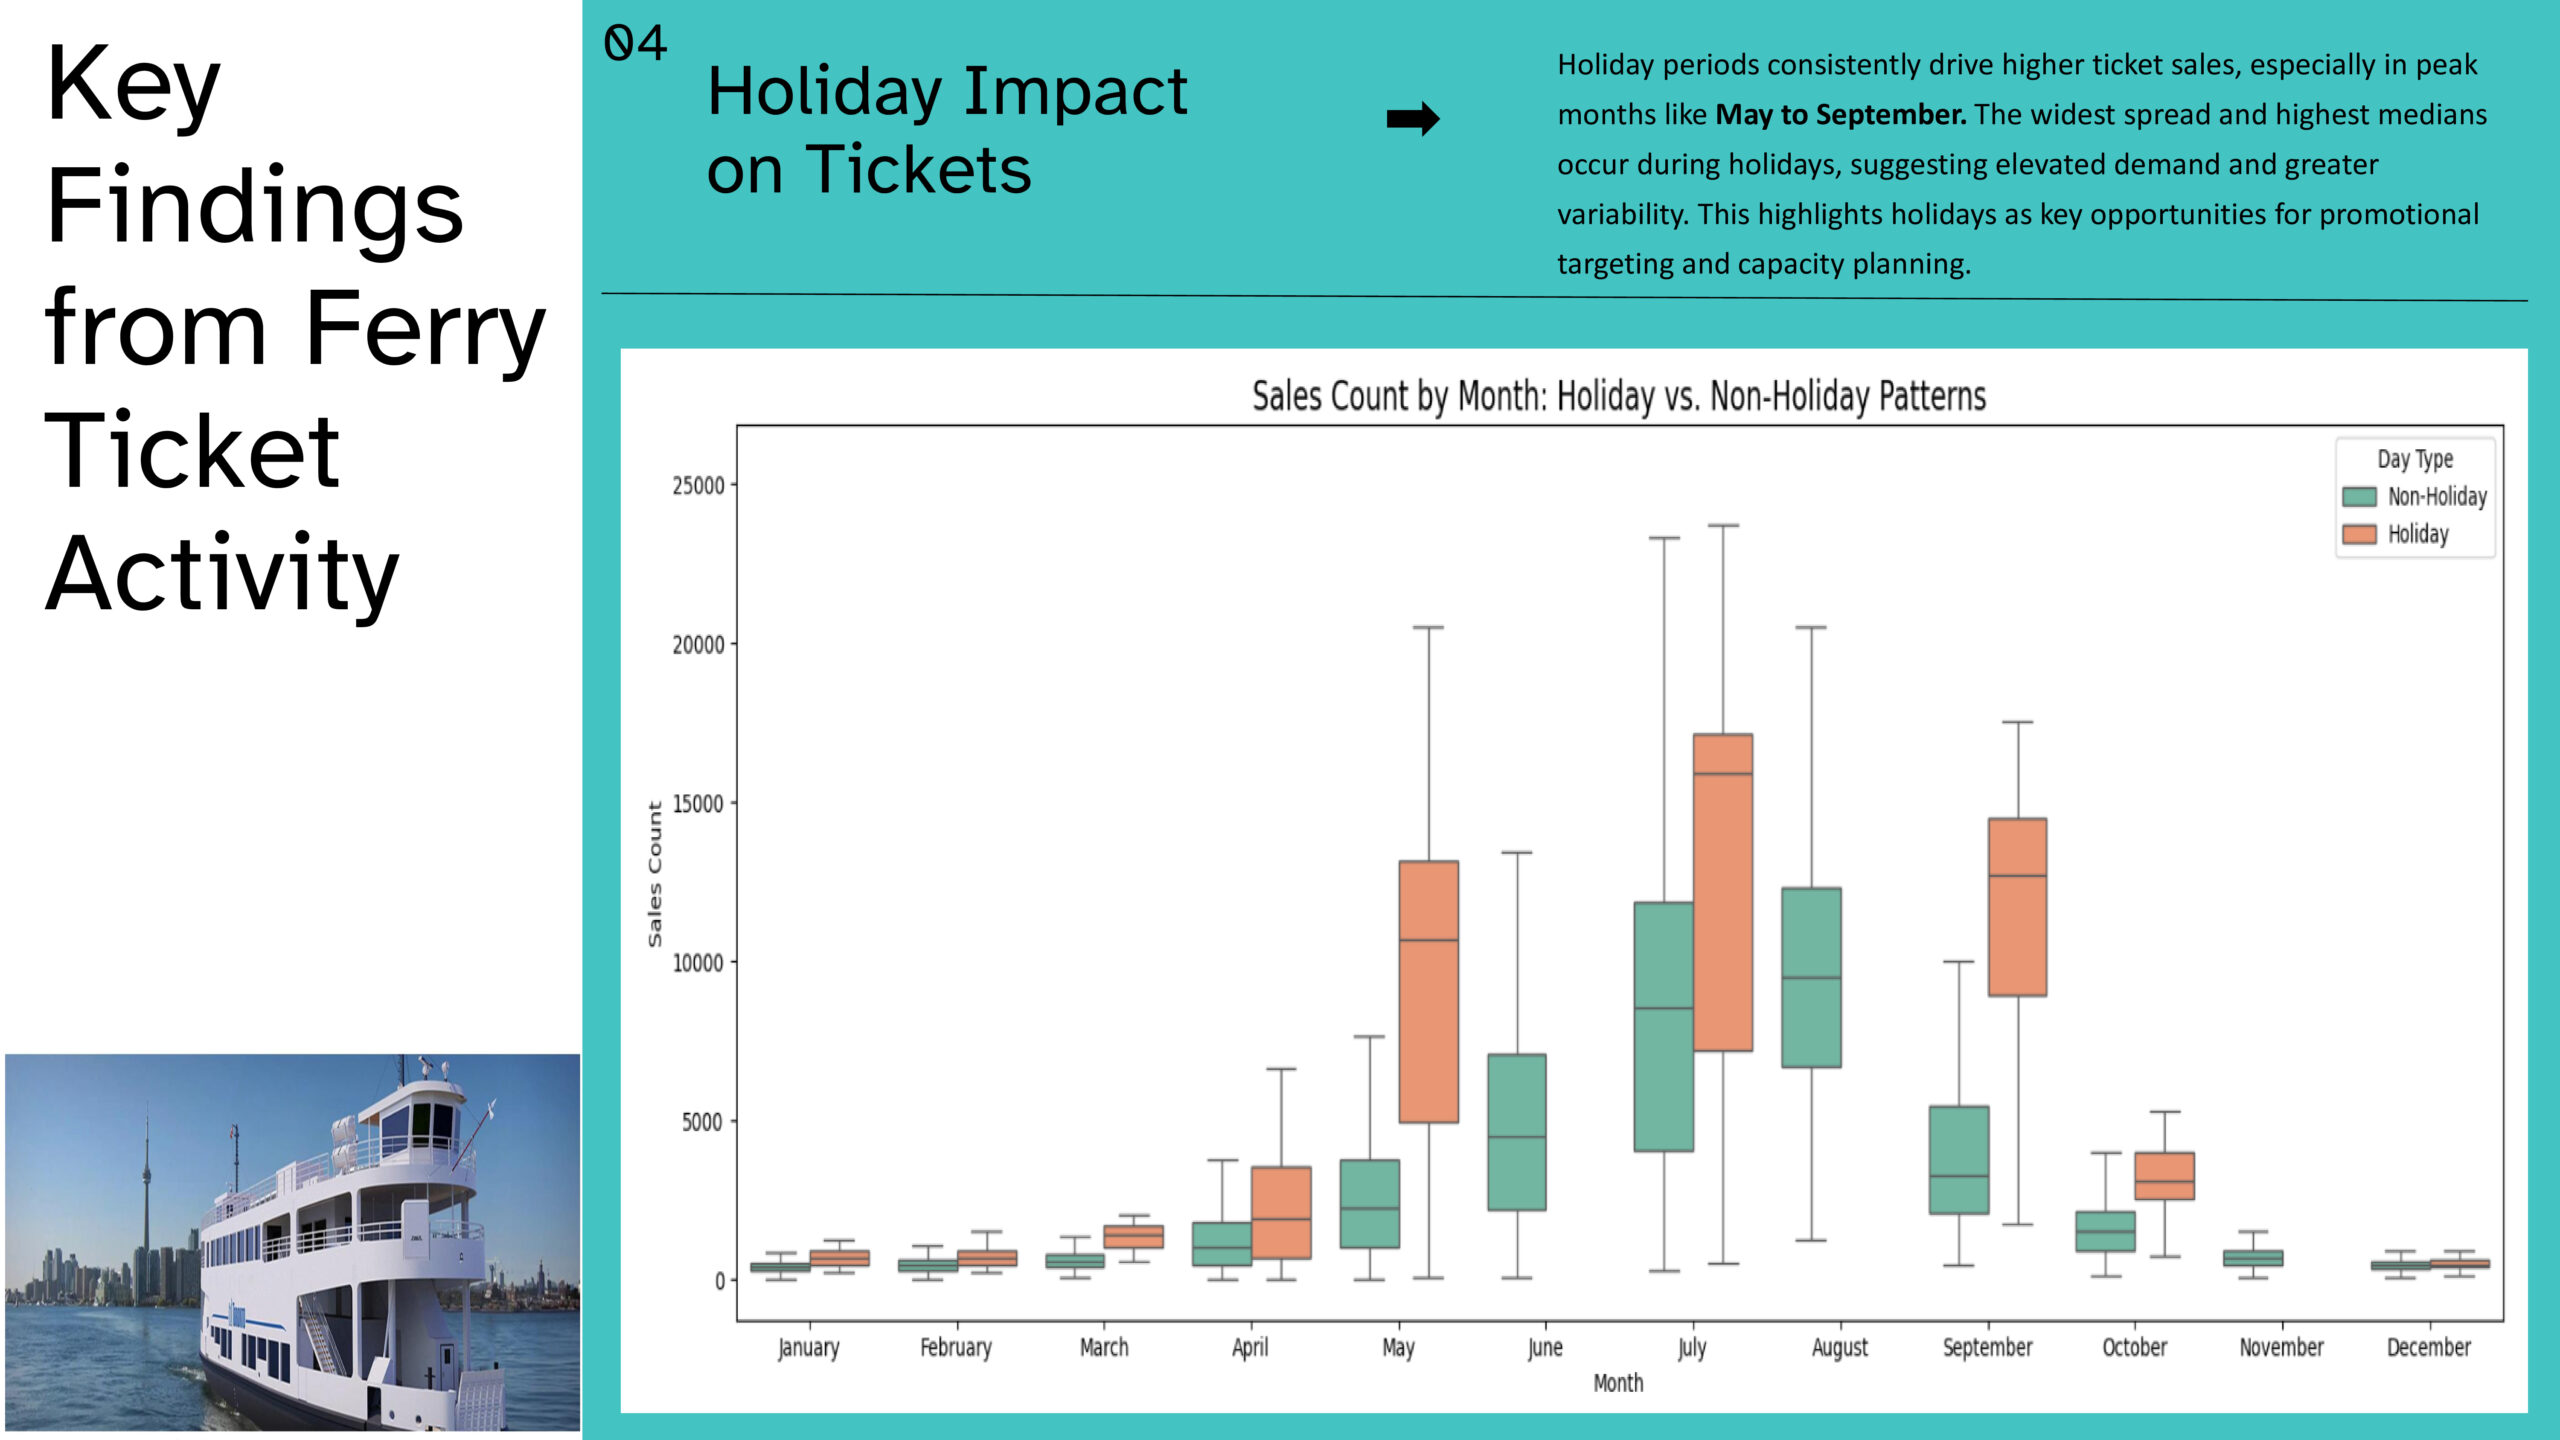
Strong Seasonality: Sales consistently spike between May and September, peaking in late June to August, aligning with warm weather and tourism peaks. Daily ferry ticket sales exhibit strong, consistent seasonal spikes each year
Weekend & Holiday Impact: Ticket sales increase significantly on weekends and holidays, especially during long weekends, suggesting potential for targeted staffing and marketing strategies.
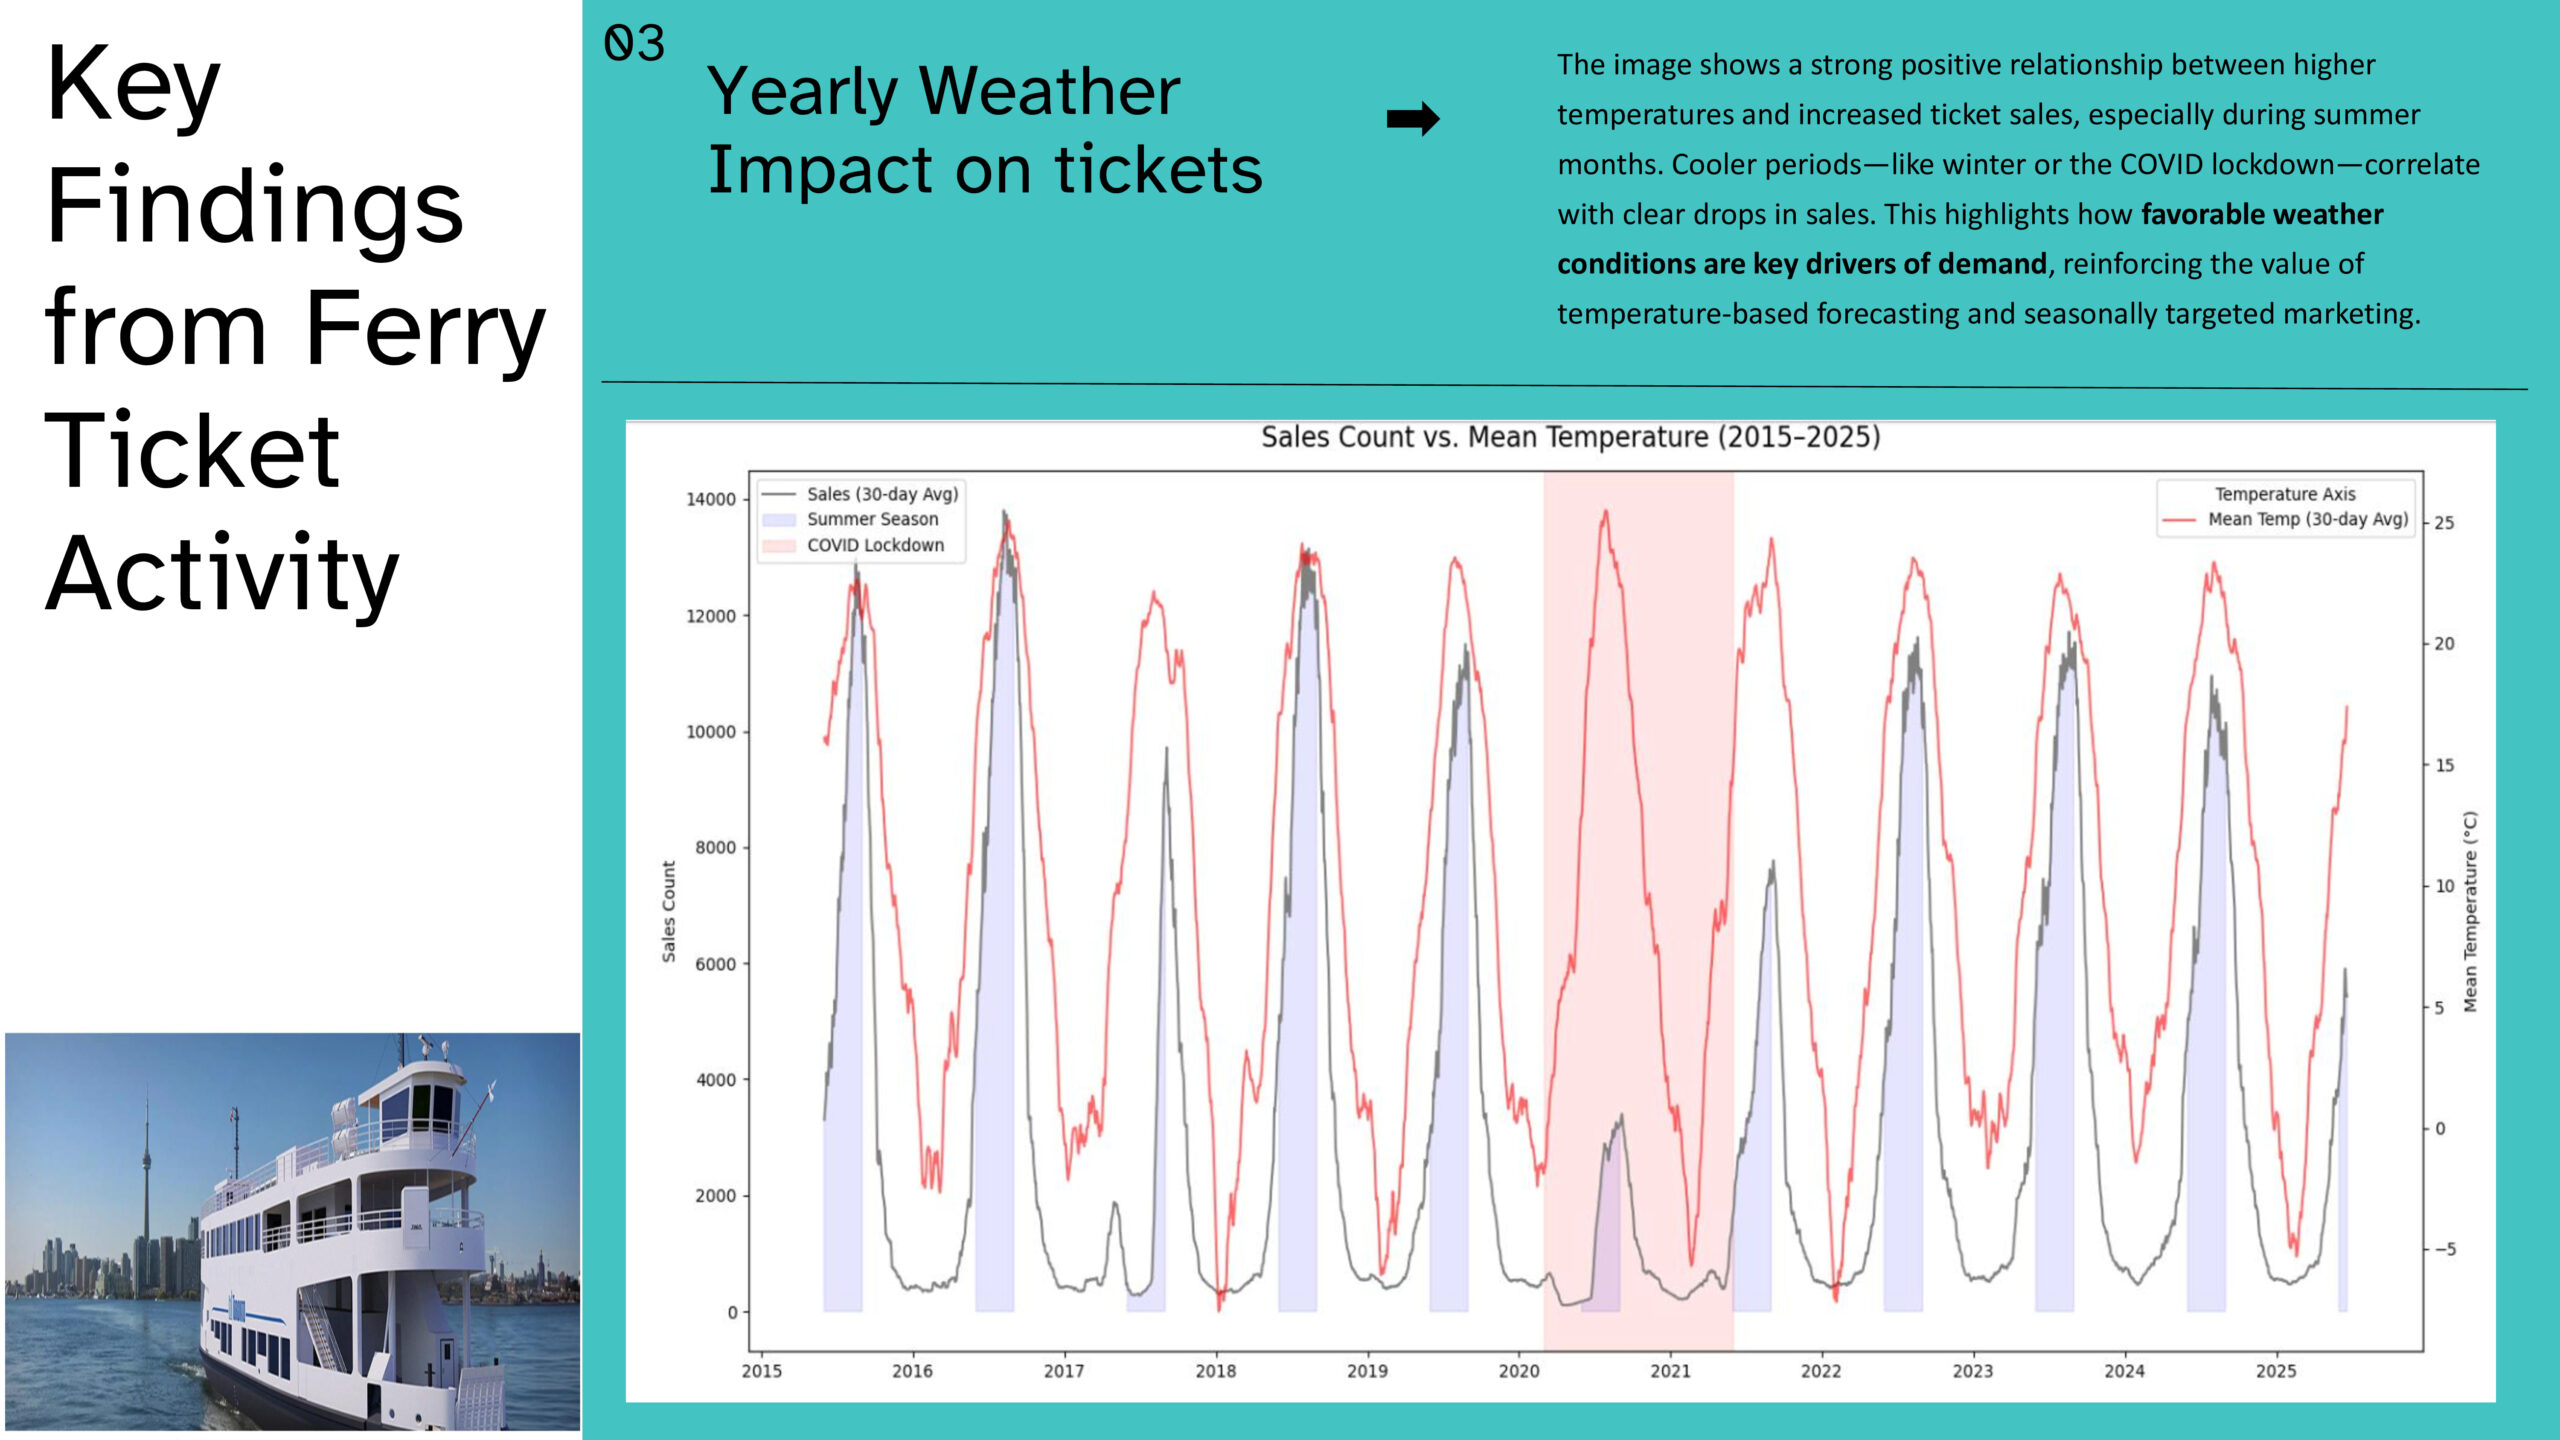
Temperature Correlation: A moderate-to-strong positive correlation exists between mean daily temperature and ticket sales. Sales tend to rise sharply once temperatures steadily exceed 10°C except during Covid-19 lockdown.
Precipitation Effect: Rainy days negatively impact sales, especially when total daily precipitation exceeds 3mm, supporting use of weather-adjusted forecasts for operations planning.
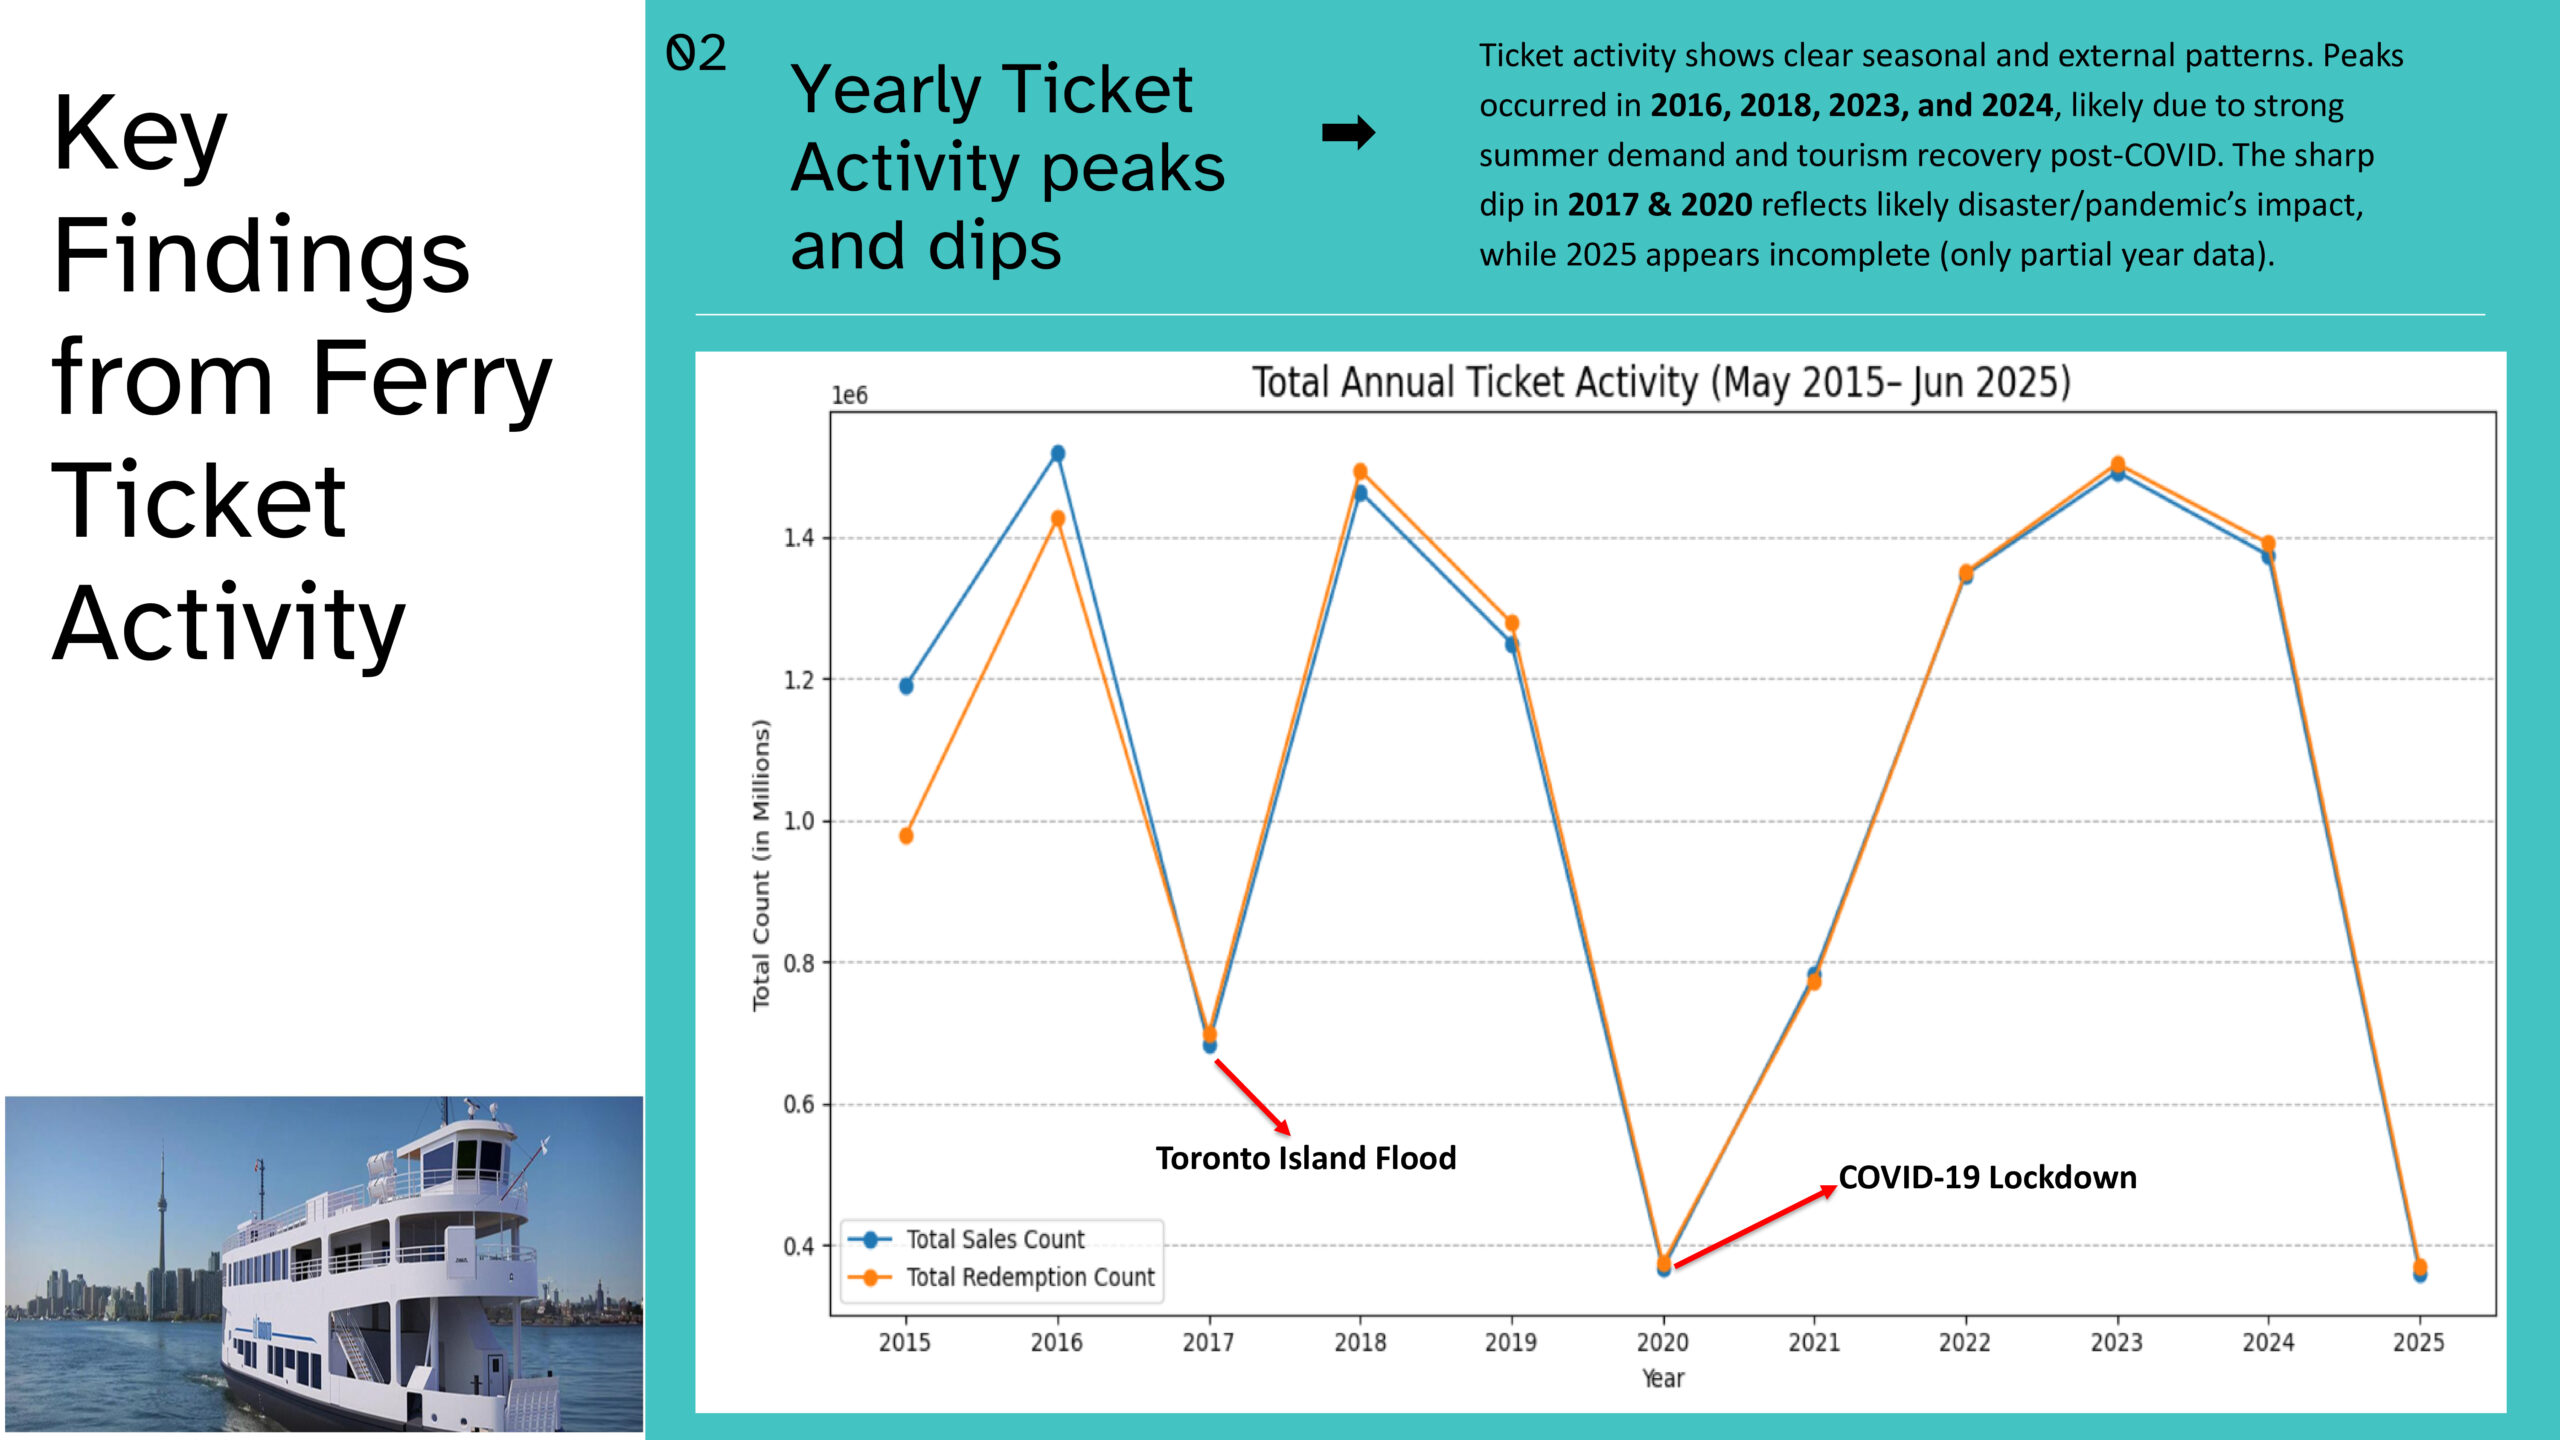
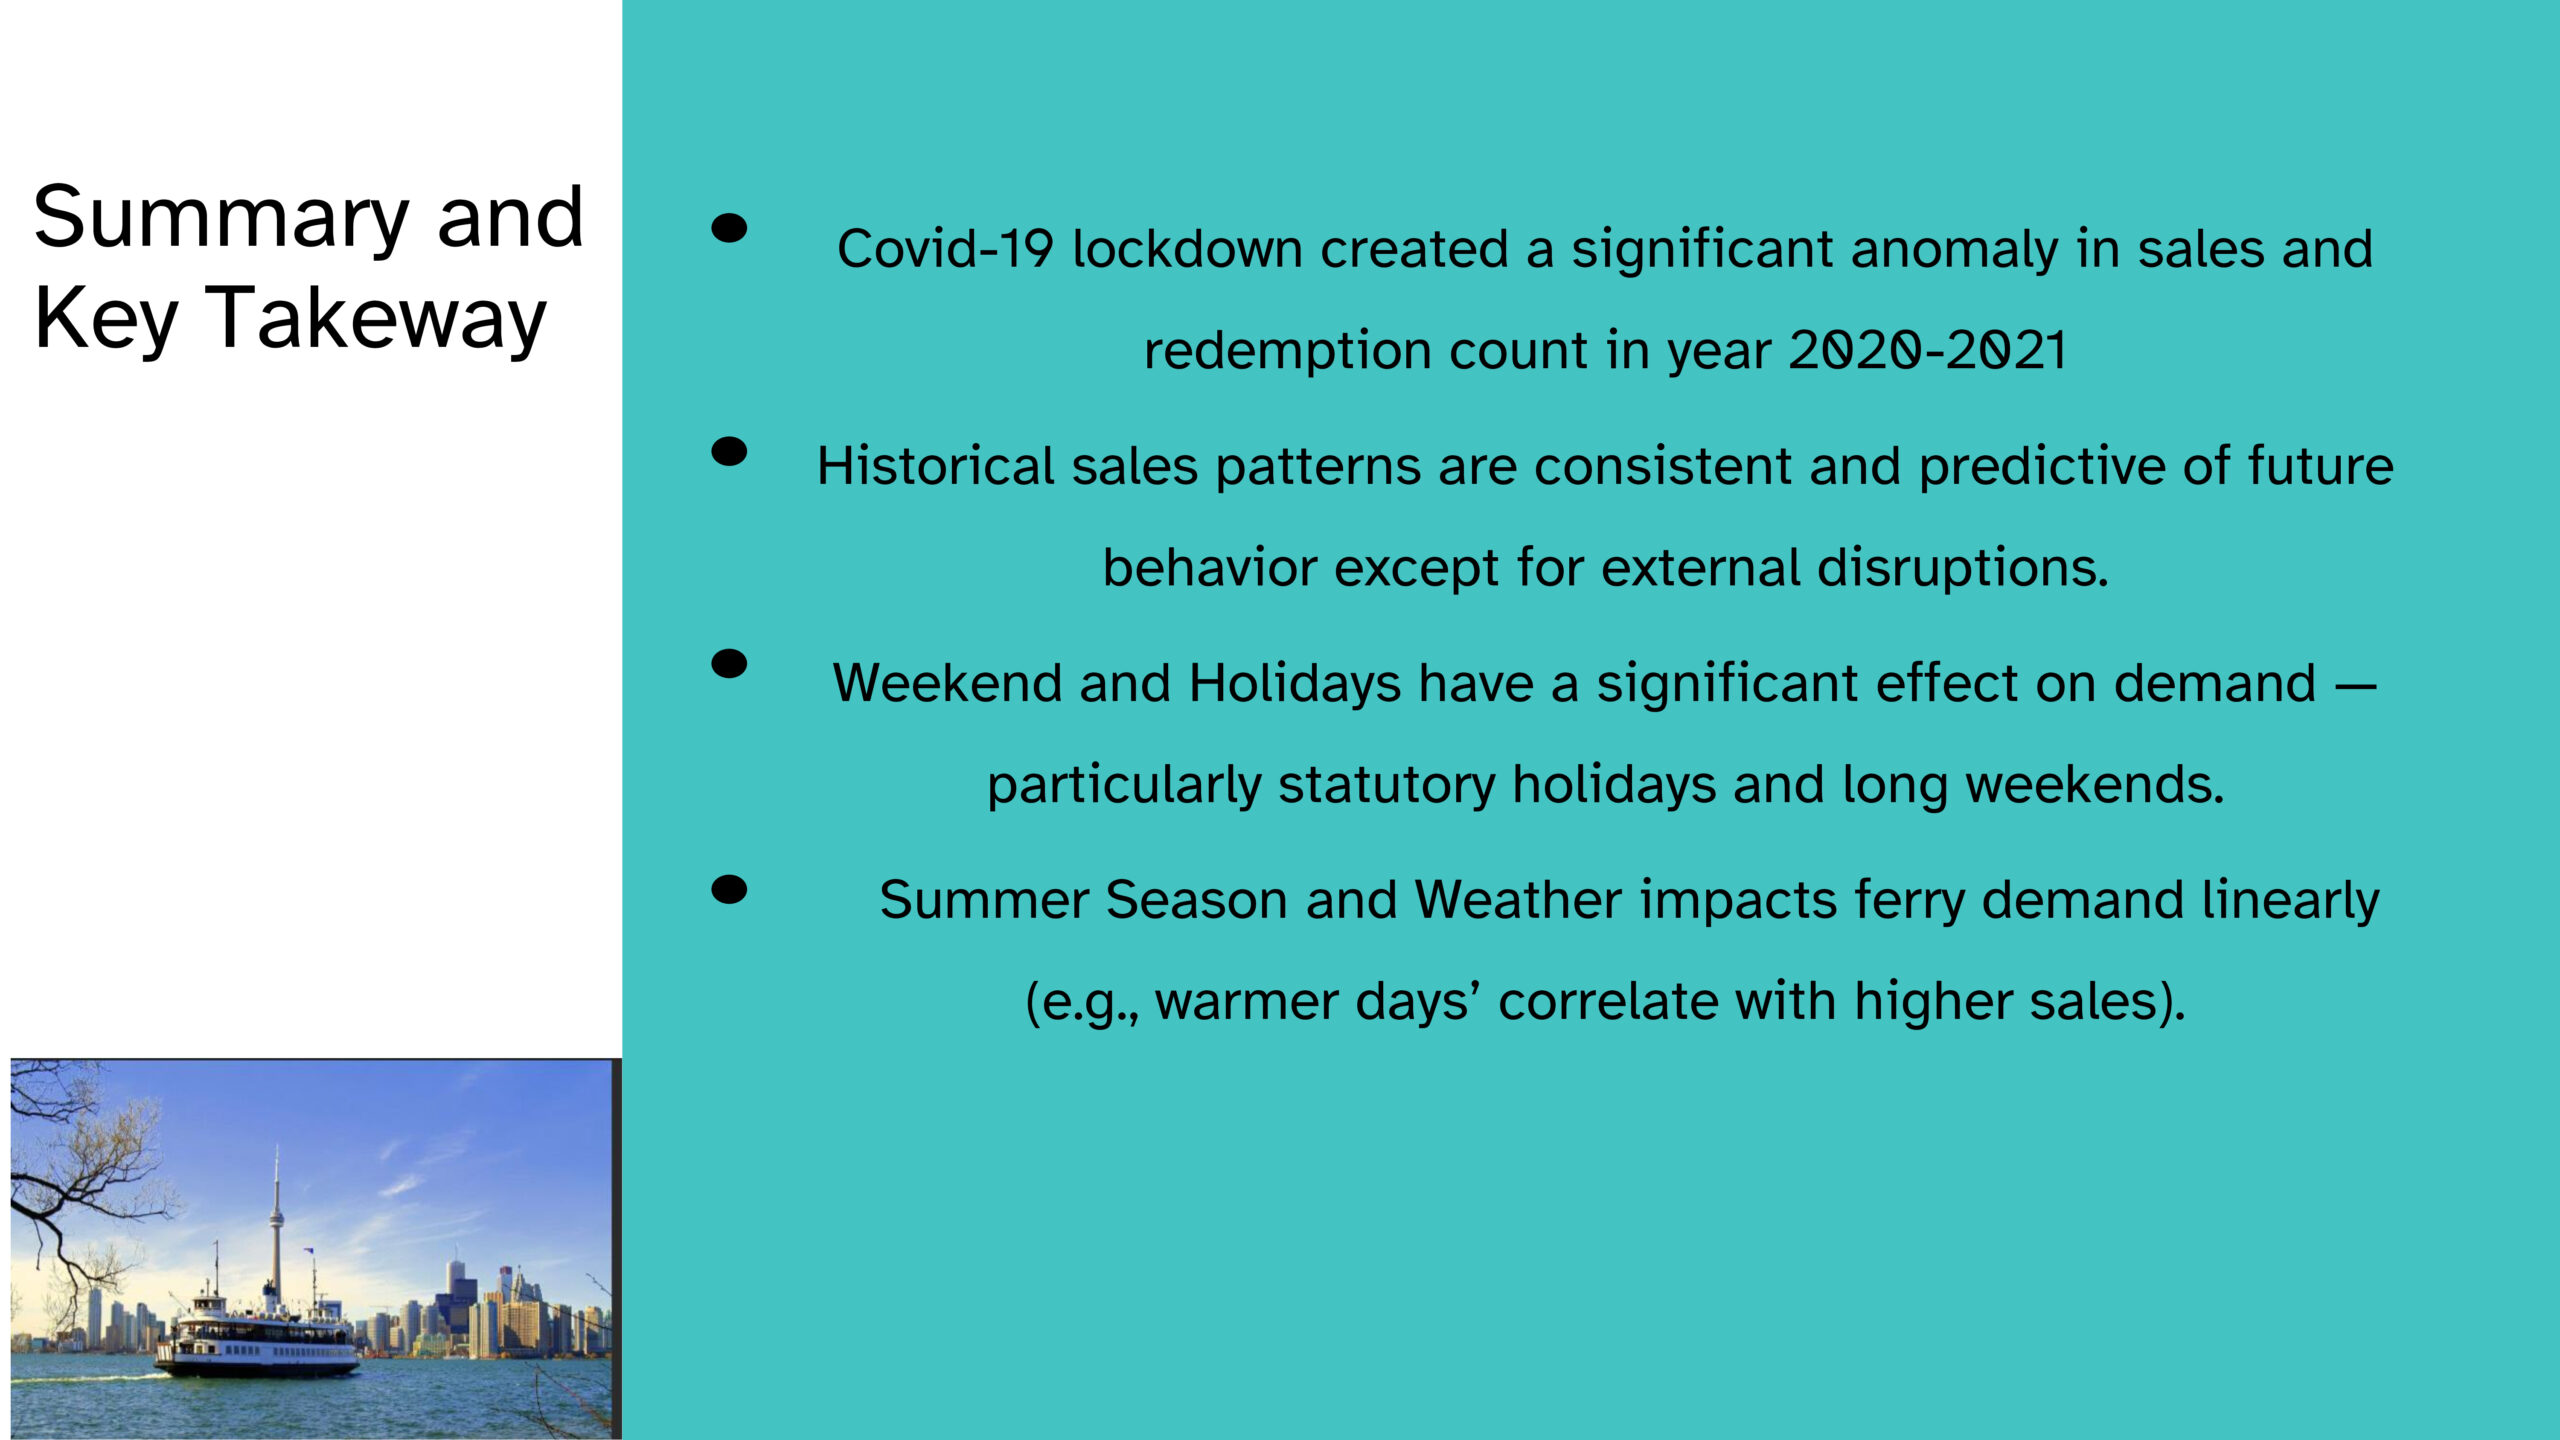
Sales vs Redemption: Purchased tickets are redeemed, and behavior patterns between buyers and users are strongly aligned (no much lag) throughout the year. Sales and Redemptions fluctuate year to year, with clear peaks in 2016, 2019, and 2023, and noticeable dips in 2017 and 2020. The pattern highlights the ferry’s cyclical demand and sensitivity to external disruptions possibly due to service changes and events like Covid-19 lockdown.
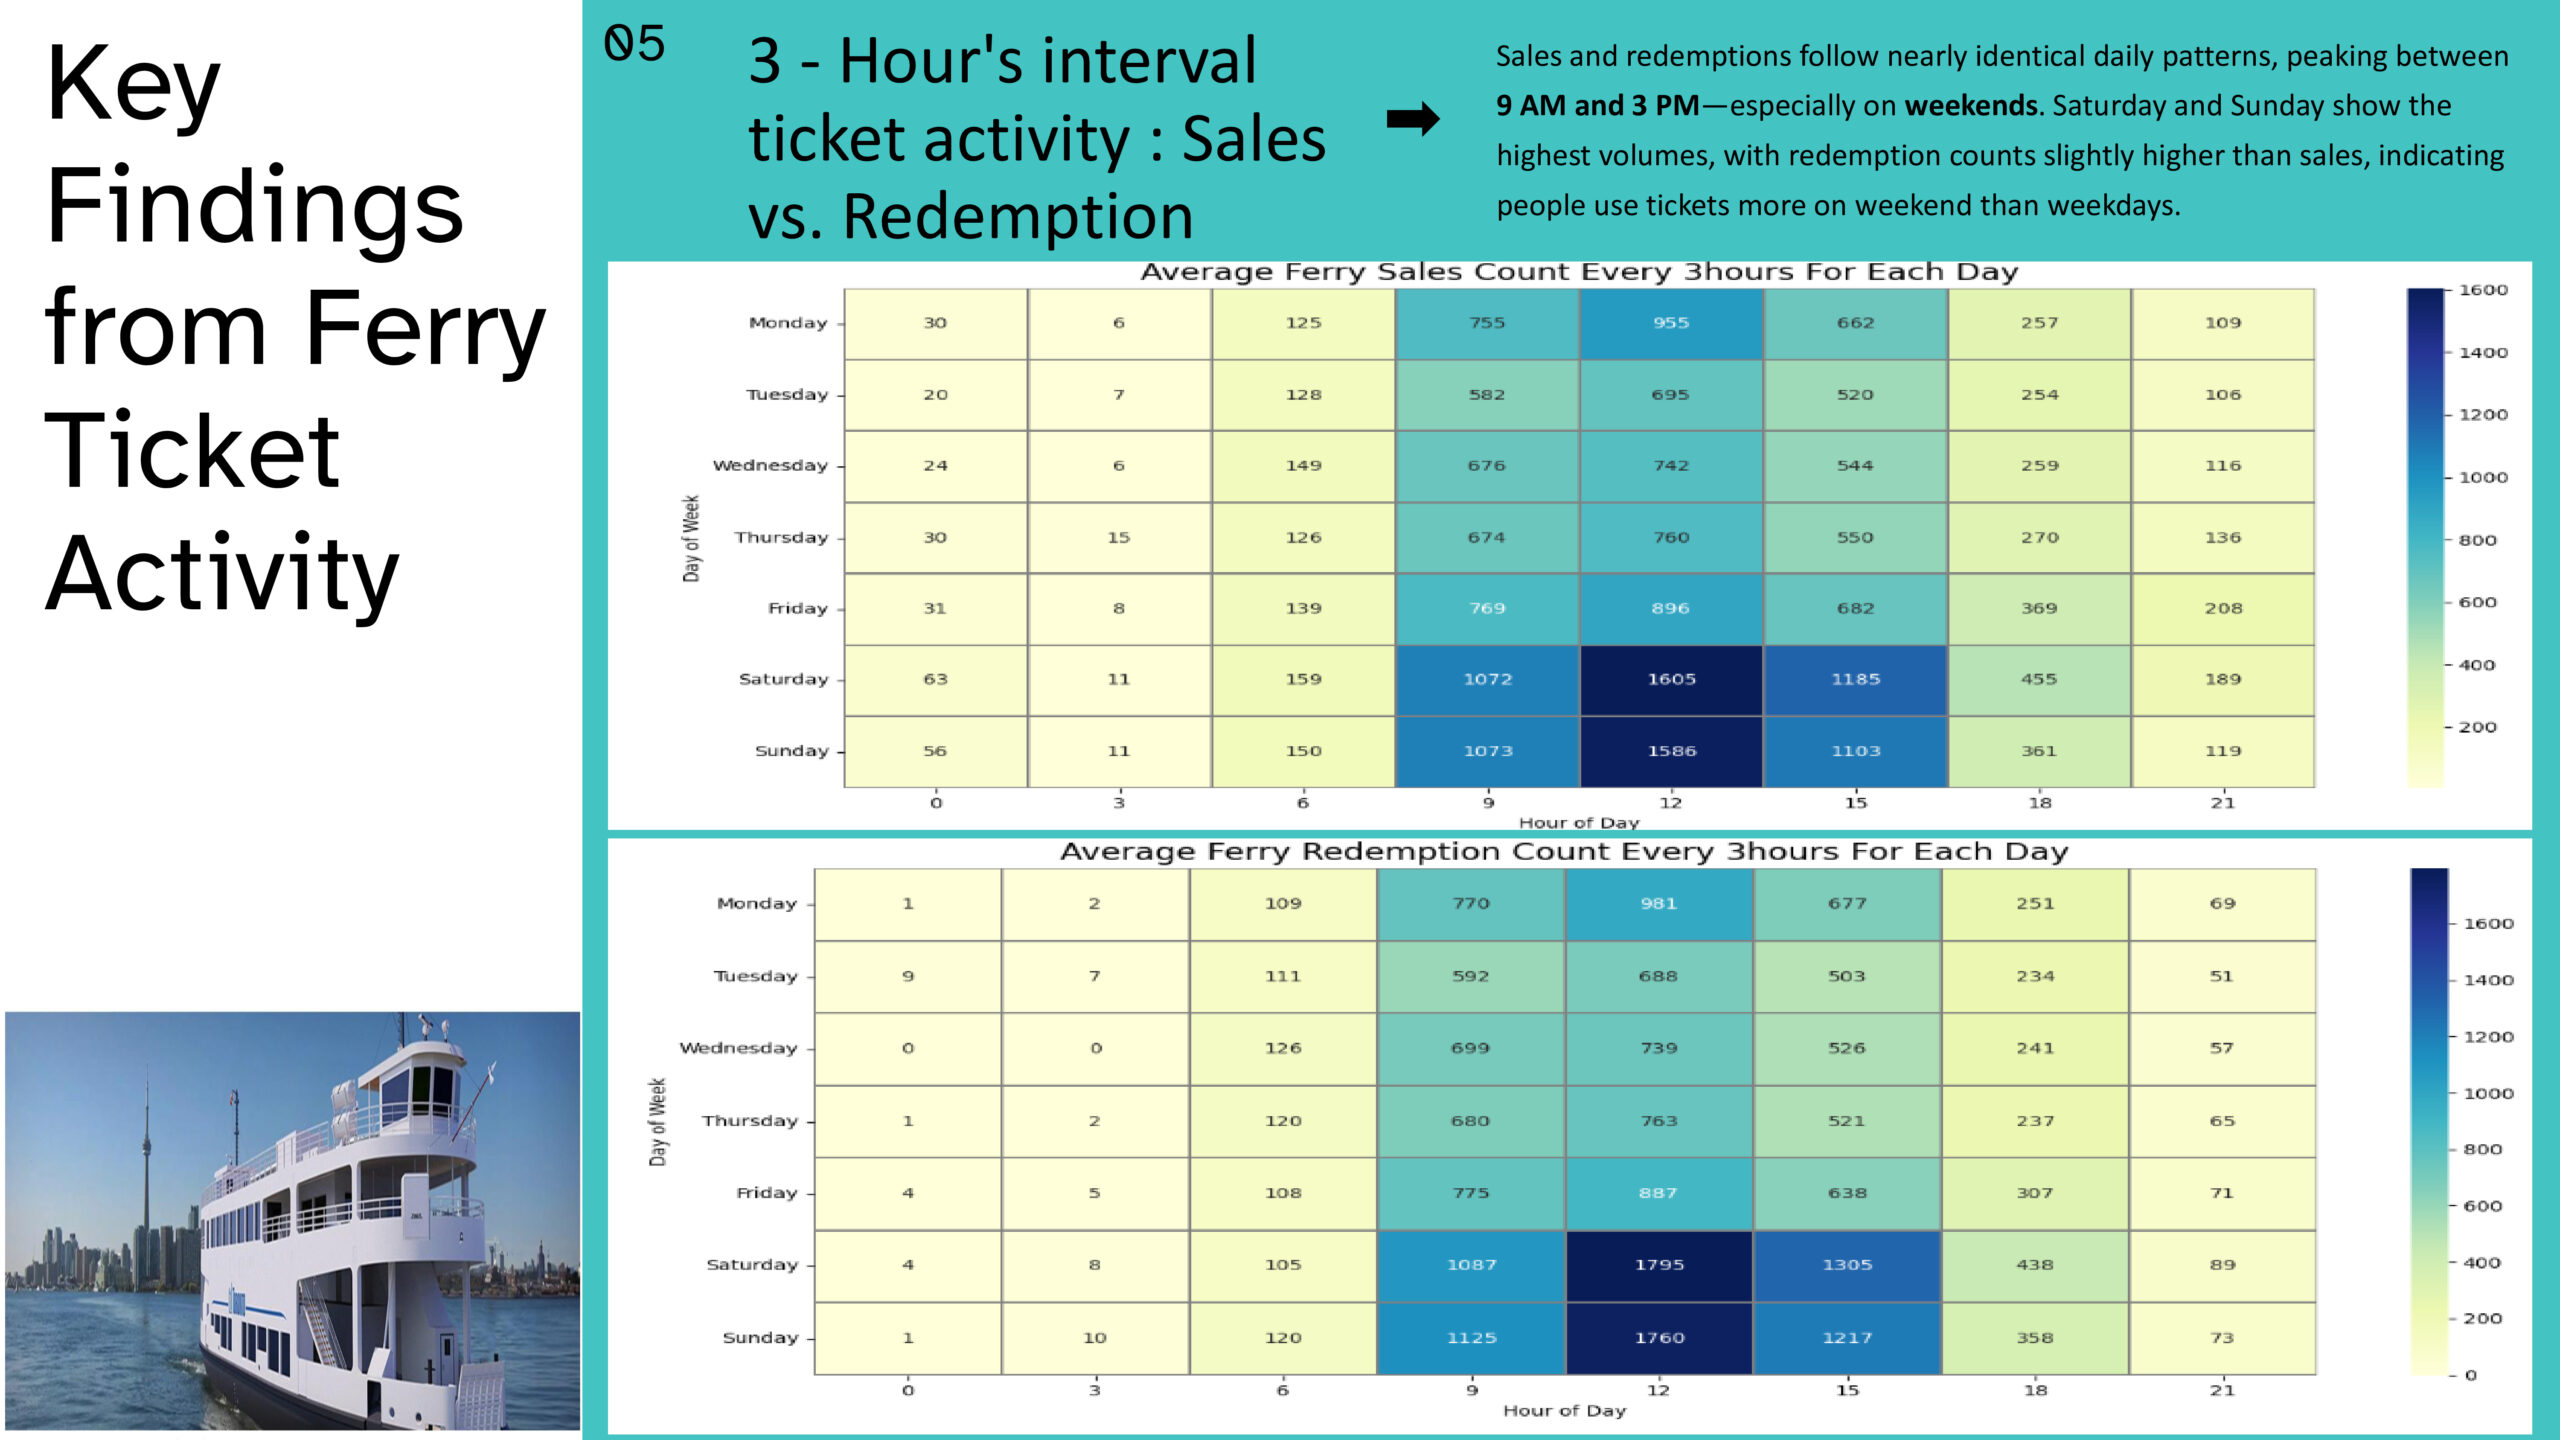
Hourly Behavior (3-Hour Interval Data)
I created a heatmap of 3-hour interval sales by weekday revealing 9AM to 4 PM as the most active time window, particularly on mid-day weekends.
More tickets were redeemed than sold between 9AM to 4 PM especially on weekends.
This is an opportunity to generate more revenue bas
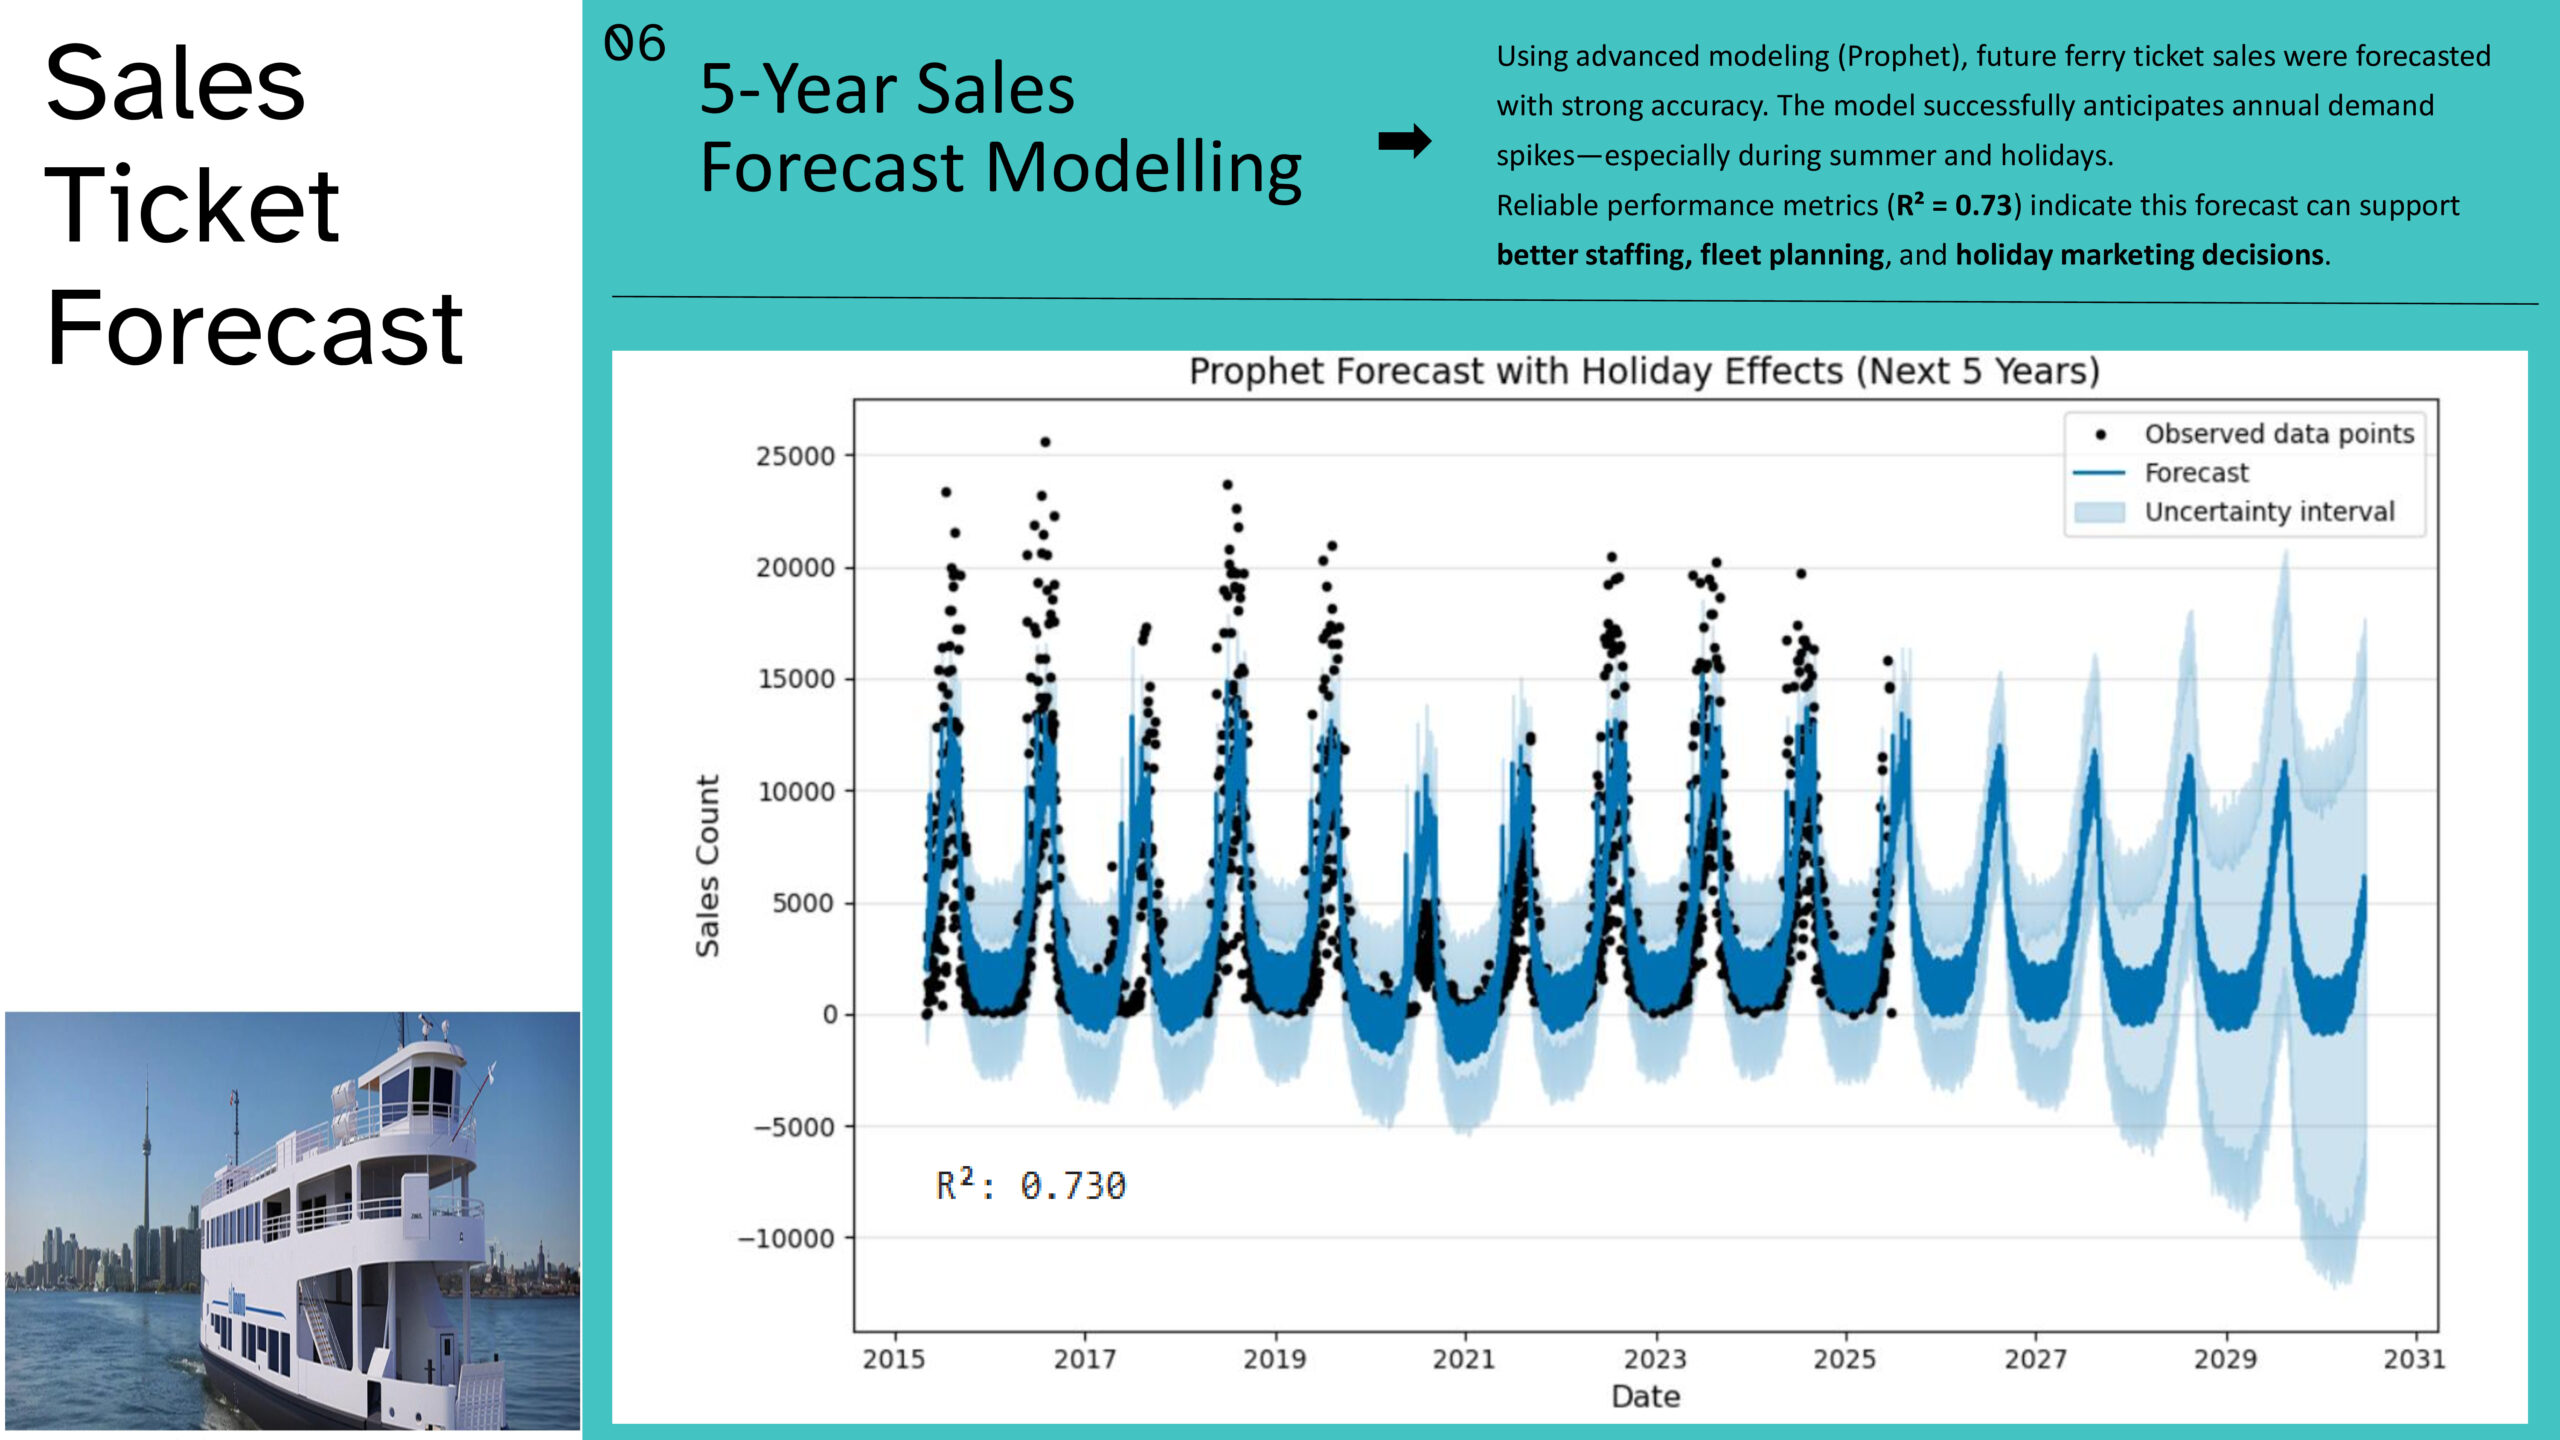
Forecasting & Predictive Modeling
I created a fairly solid Prophet model to forecast sales for the next 5 years.
Model captures most of the signal, especially seasonal trends, but some residual noise or outliers remain. Normalized RMSE: 0.591, Normalized MAE: 0.418, R²: 0.730. There is room for improving this forecast.
Wide confidence intervals and negative lower bounds indicate the need to optimize parameters or integrate other sources of data or try another seasonal modeling like (SARIMA Xgboost)
Business Recommendations
Optimize Capacity & Staffing: Increase Fleet resources and staffing this summer especially on weekends and long holidays; scale back during winter or rainy periods. Additionally, ensure optimal hourly fleet scheduling between 9AM and 4PM.
Seasonal Marketing Campaigns: Leverage insights to promote early summer and shoulder season travel — particularly targeting Fridays and warm Saturdays and Sundays.
Weather-Aware Forecasting: Combine temperature and precipitation variables with seasonal modeling to drive demand-responsive ferry scheduling.