Business Problem: The transportation company lacked insight into rider behavior, booking patterns, and operational inefficiencies. They needed data-driven recommendations to optimize vehicle deployment, enhance customer loyalty, and increase profitability.
Solution & Analysis: Using Power BI, I developed an interactive dashboard that analyzed 100K+ trips across key metrics:
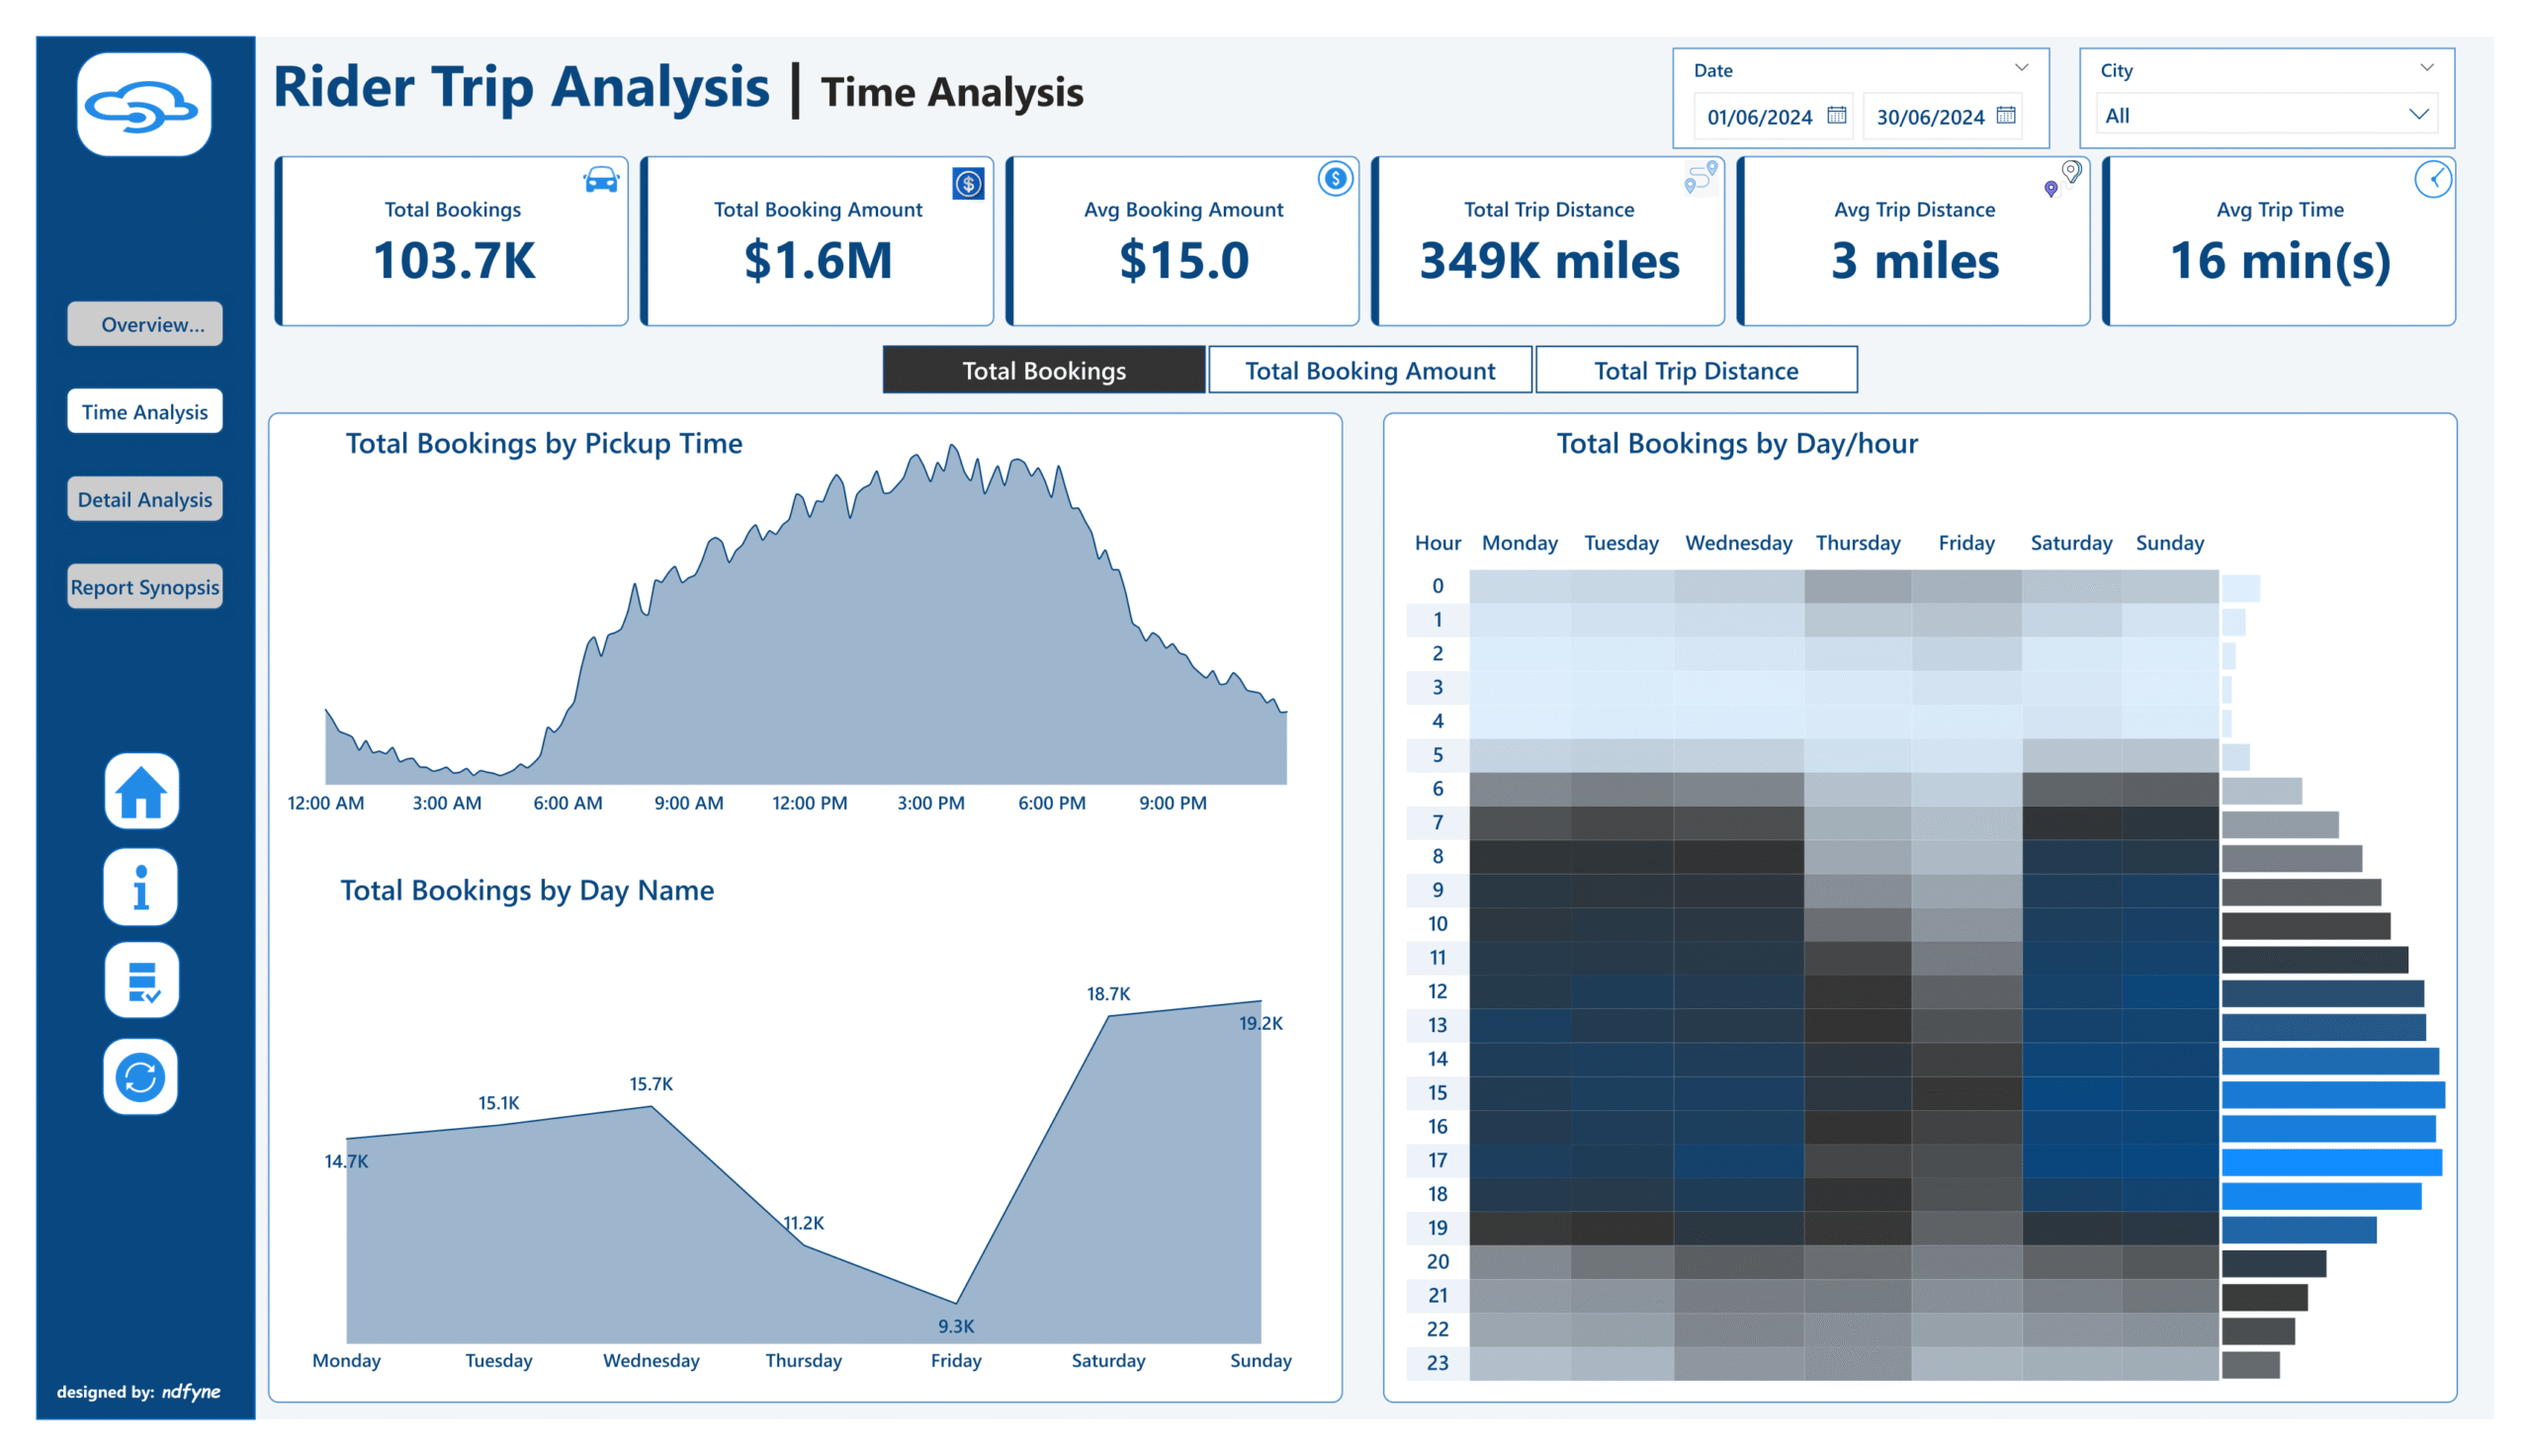
Peak booking days and hours (time analysis)
Most/least used vehicle types
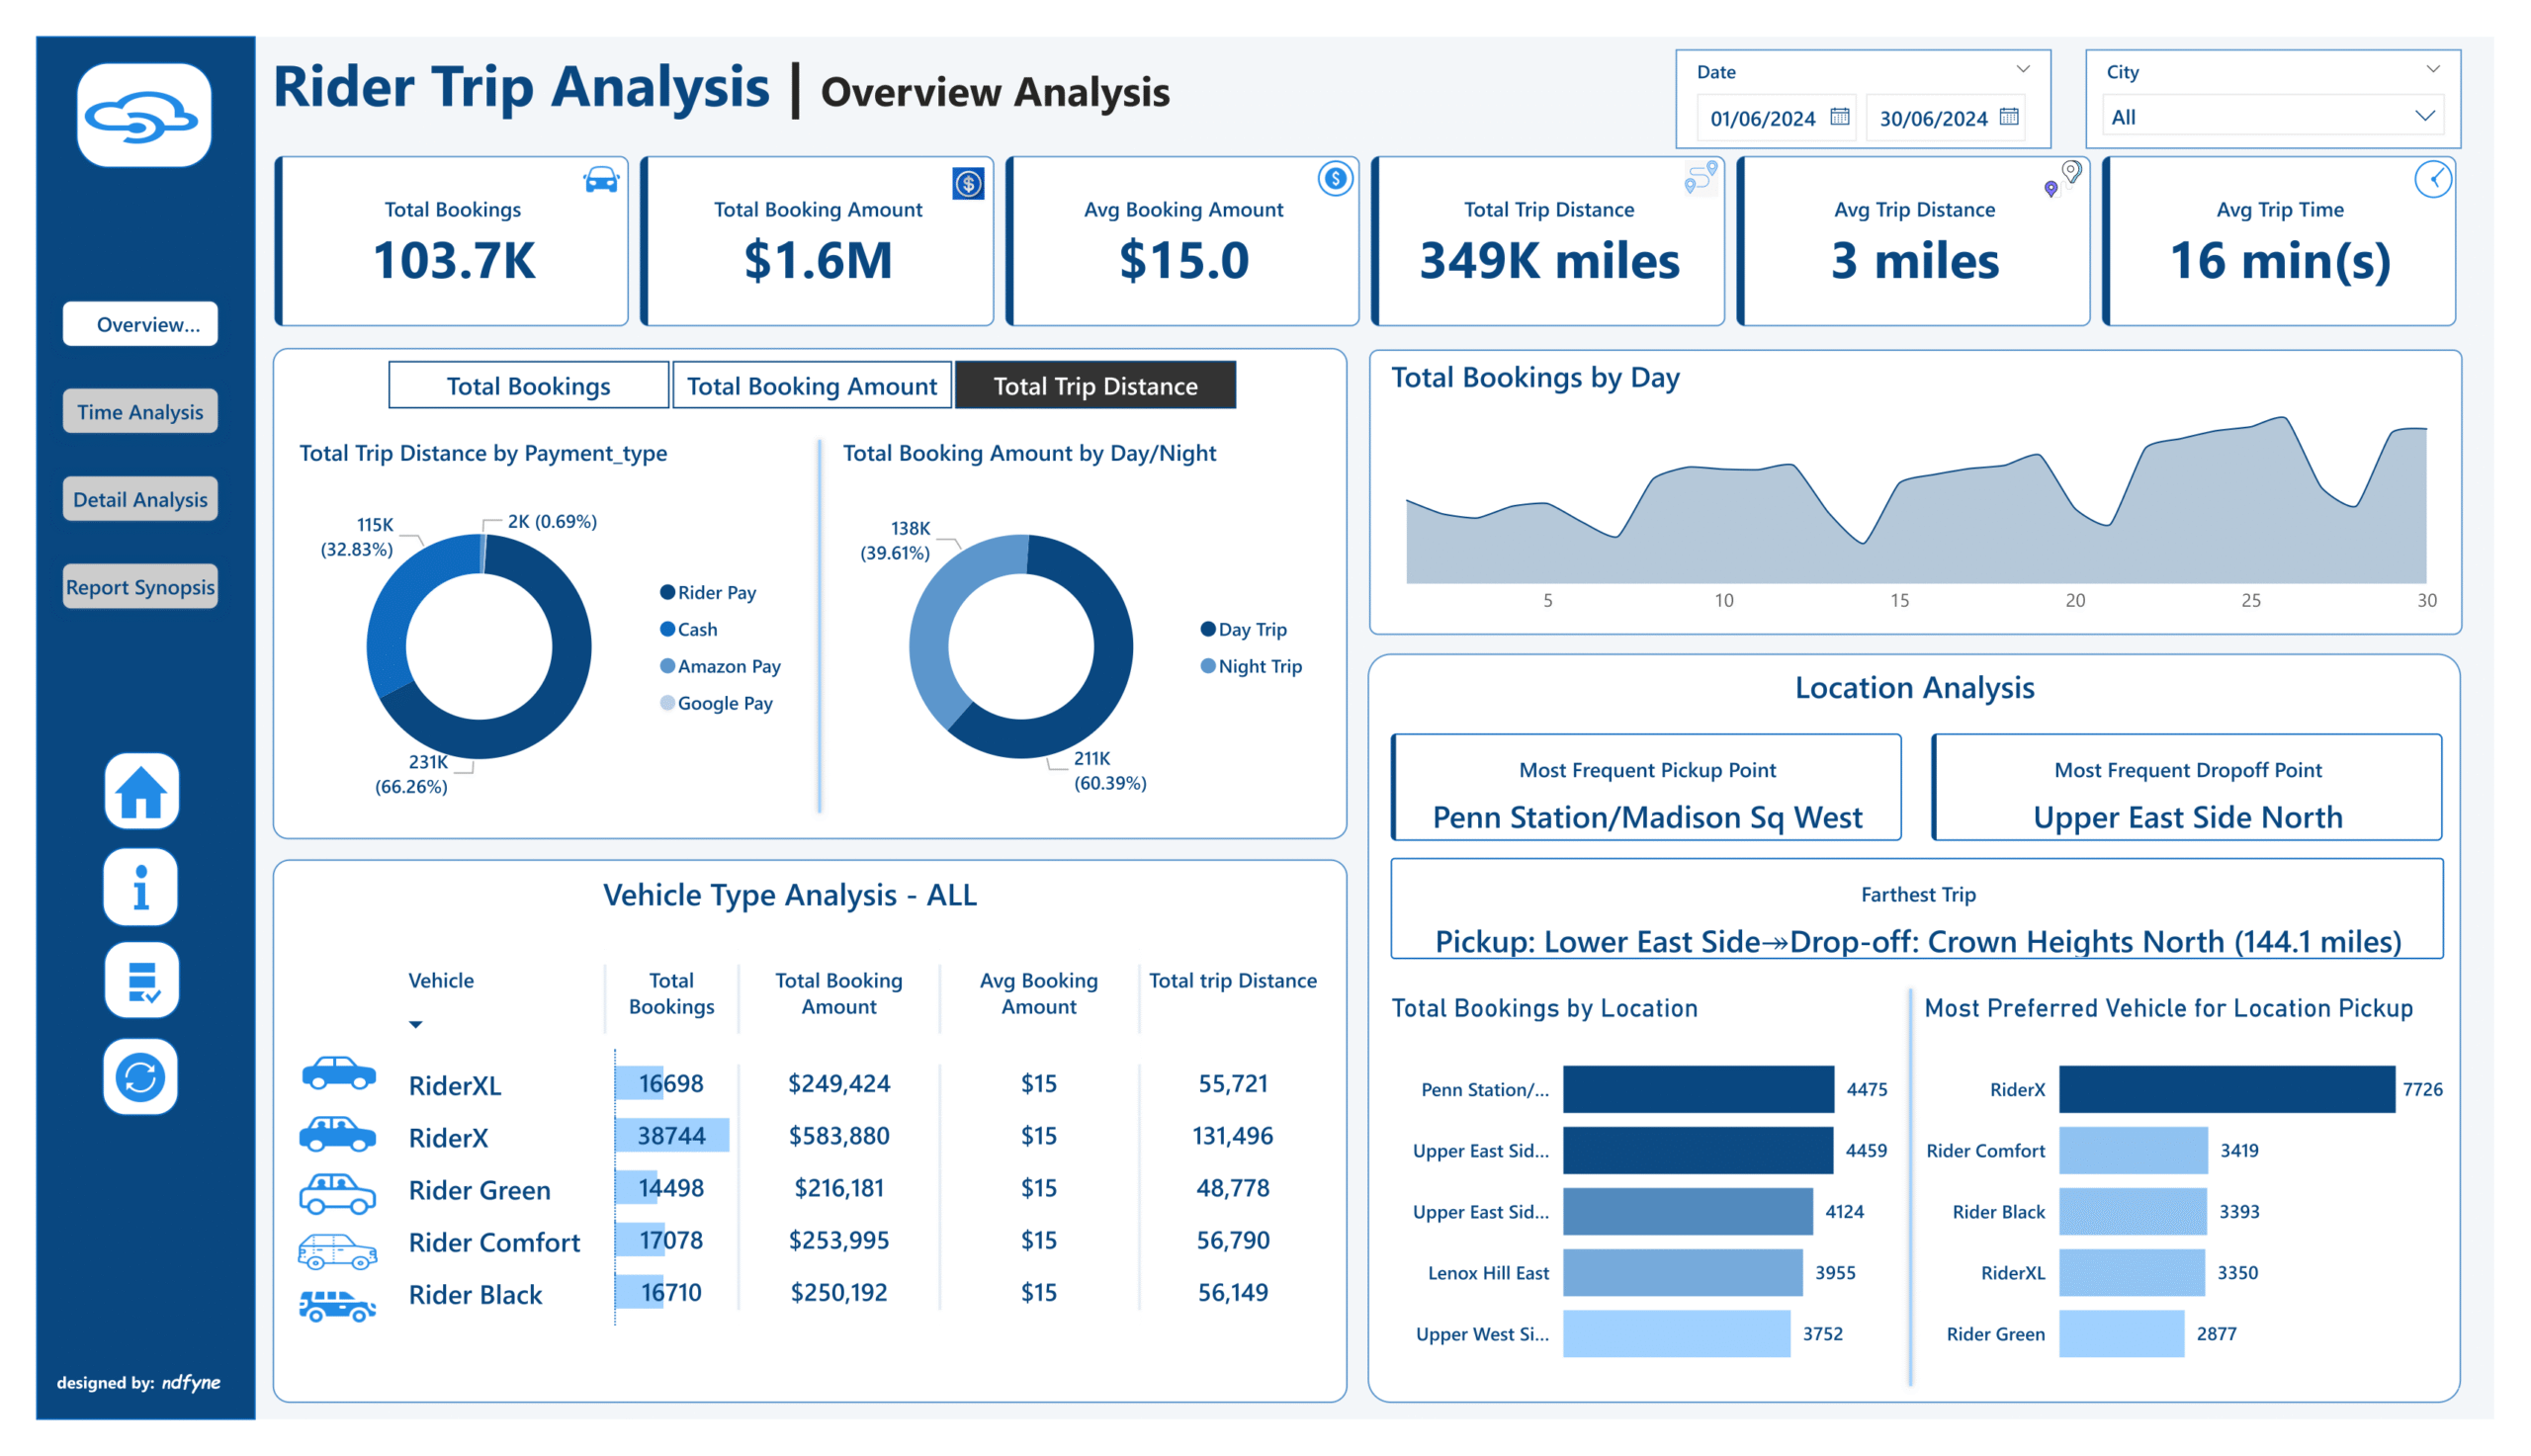
Farthest and shortest trip patterns
Preferred payment methods
Location-based performance
Key features included:
Dynamic drill-through views (by time, location, and vehicle)
KPI cards (avg booking, distance, trip time)
Slicers, bookmarks, dynamic parameters, dynamic titles and page navigation for seamless storytelling.
Insights:
60% of rides occurred during the day, with peaks between 3–4PM
RiderX was the most used vehicle; RiderPay was the most popular payment method
Bookings spiked between the 22nd and 26th of each month
Weekend usage was highest, especially Saturdays and Sundays
The farthest trip recorded was 144.1 miles (Lower East Side → Crown Heights North)
Recommendations:
Reallocate vehicle supply to peak hours and weekends for increased ride fulfillment
Launch “End-of-Month Rewards” campaigns to boost loyalty
Promote premium long-distance packages for high-margin routes
Incentivize use of RiderPay with cashback/partnerships
Prioritize high-demand vehicle types (RiderX & RiderXL) through driver incentives and forecasting.
Gather customer data to understand their ride behaviors based on demographics
Outcome: This project demonstrated how real-time trip data can inform fleet strategy, promotional planning, and customer engagement, leading to: