📊 Global Sales & Shipping Analysis Dashboard (Power BI)
Business Problem:
The company lacked a clear, data-driven understanding of its global sales, customer profitability,
shipping performance, and product trends. Leadership needed actionable insights to optimize
marketing, logistics, and pricing strategies across multiple countries and segments.
Key Insights:
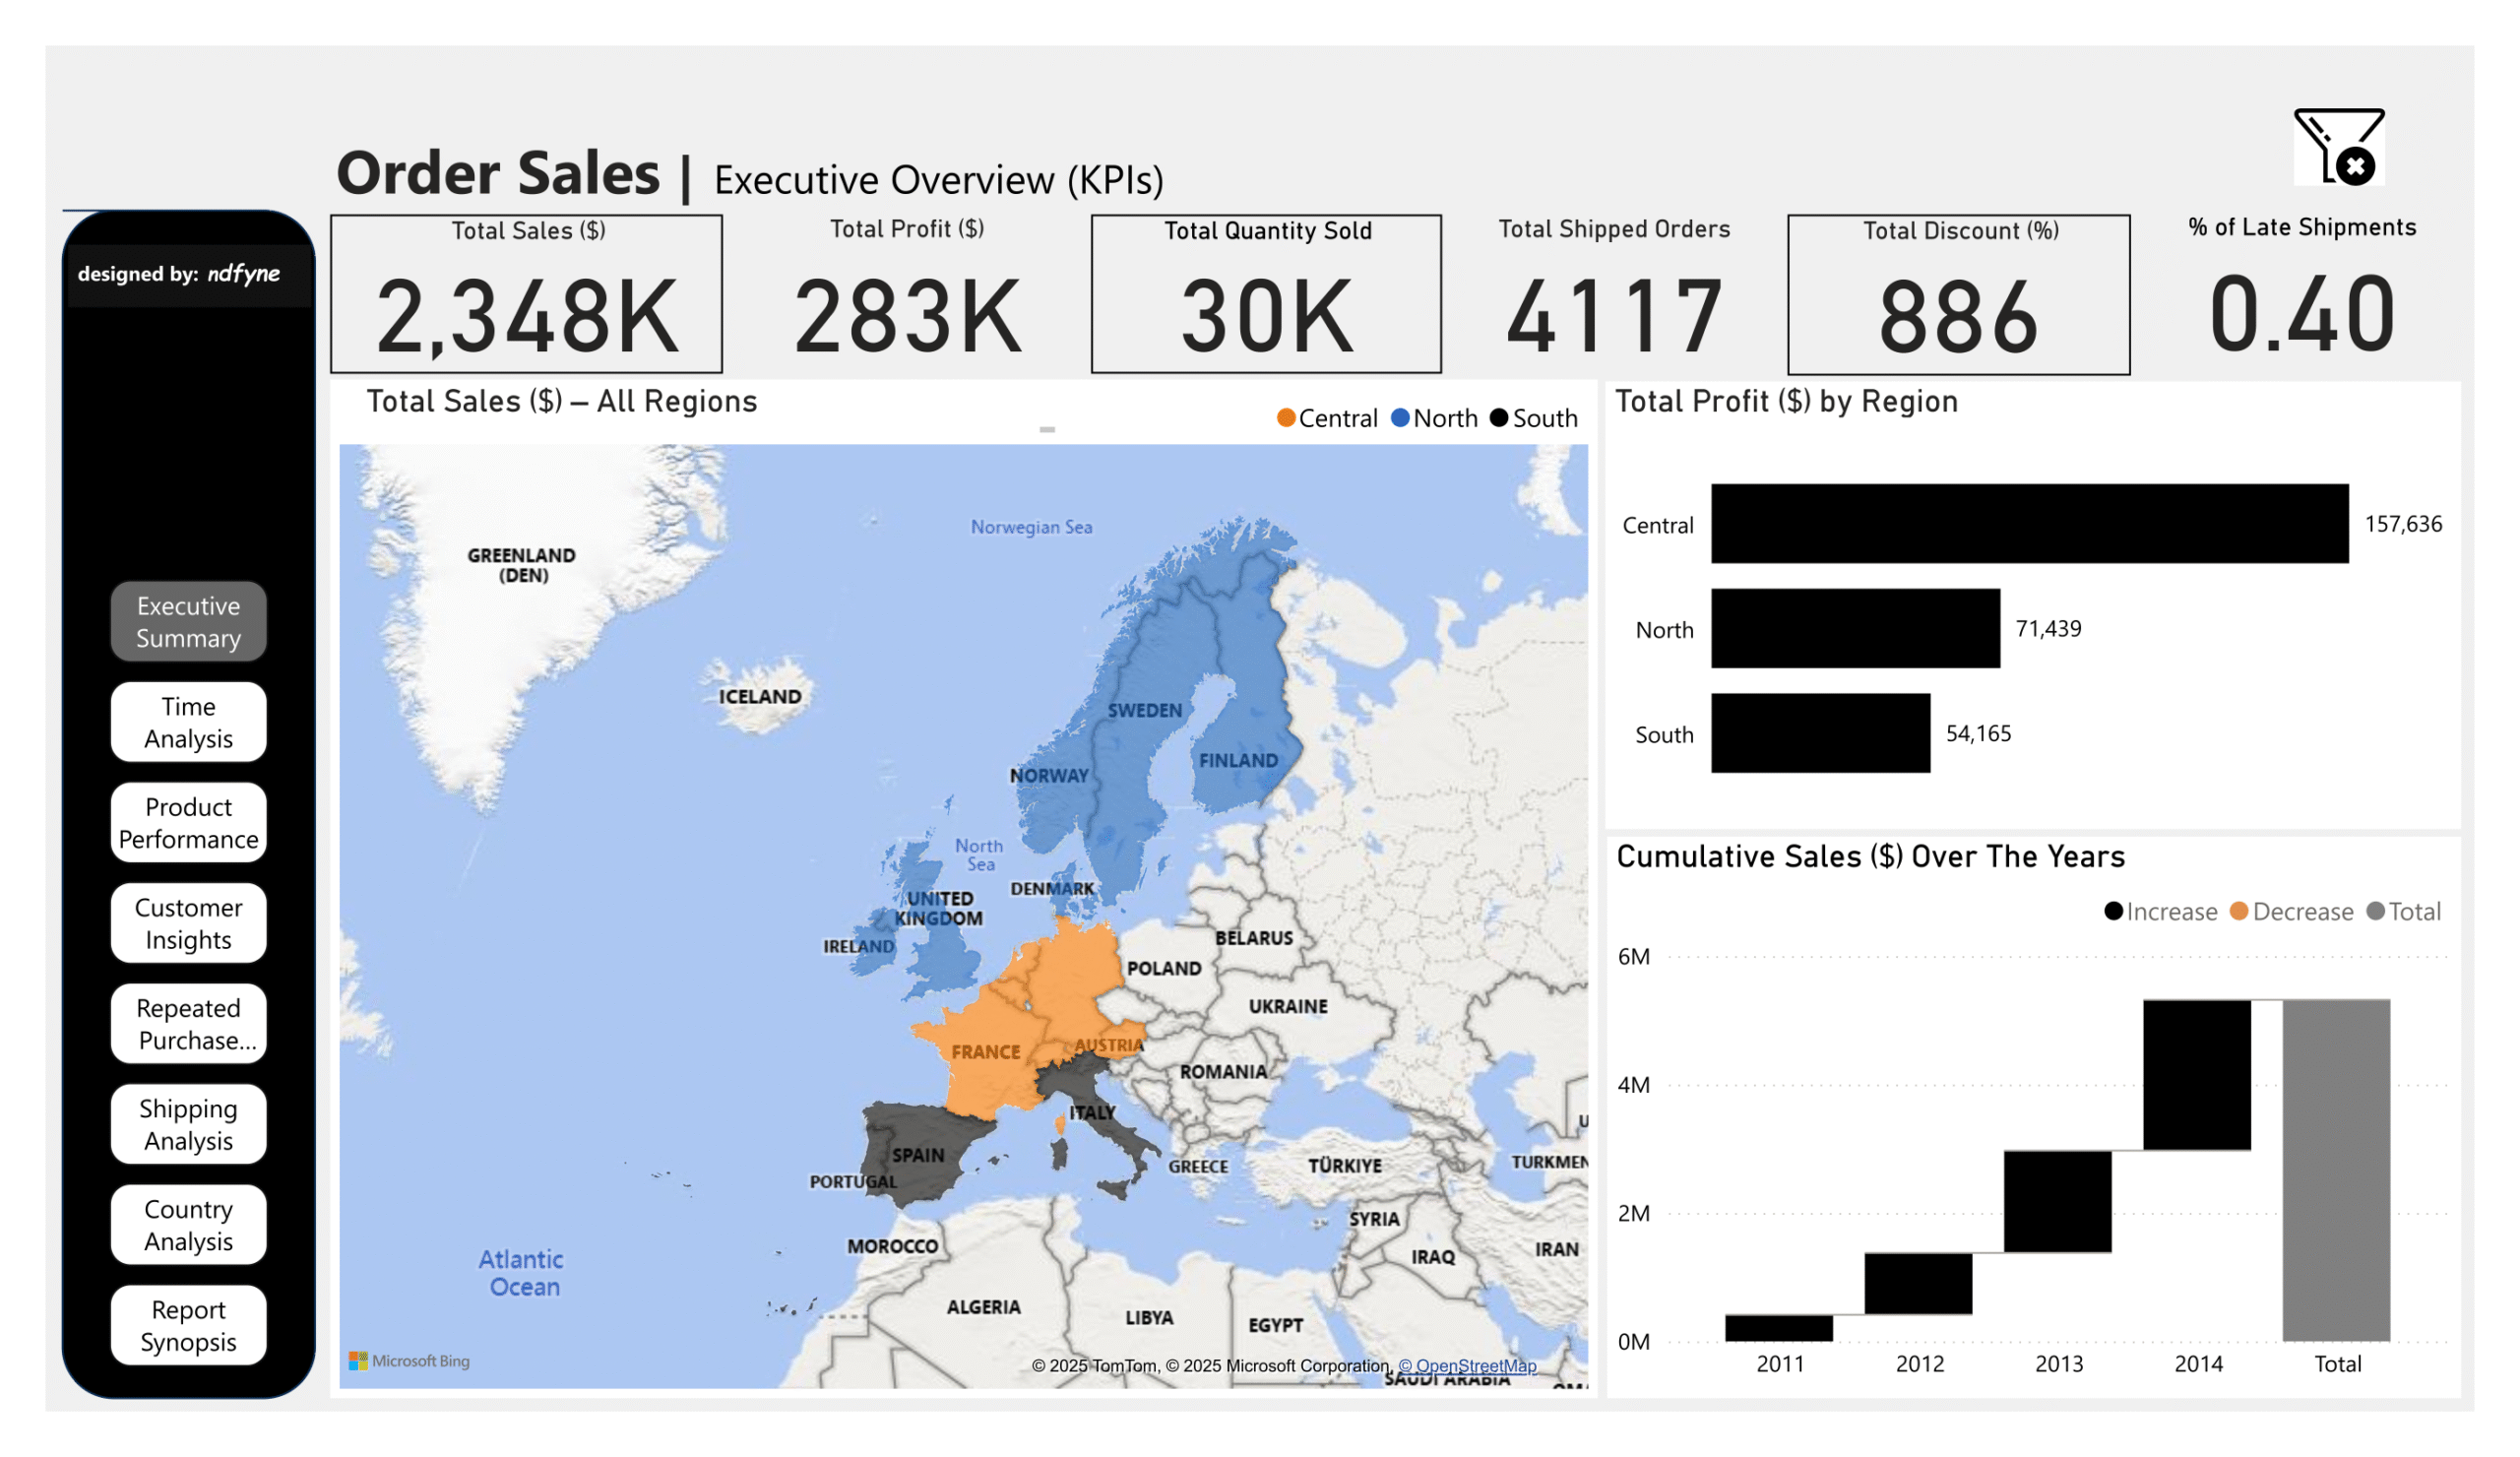
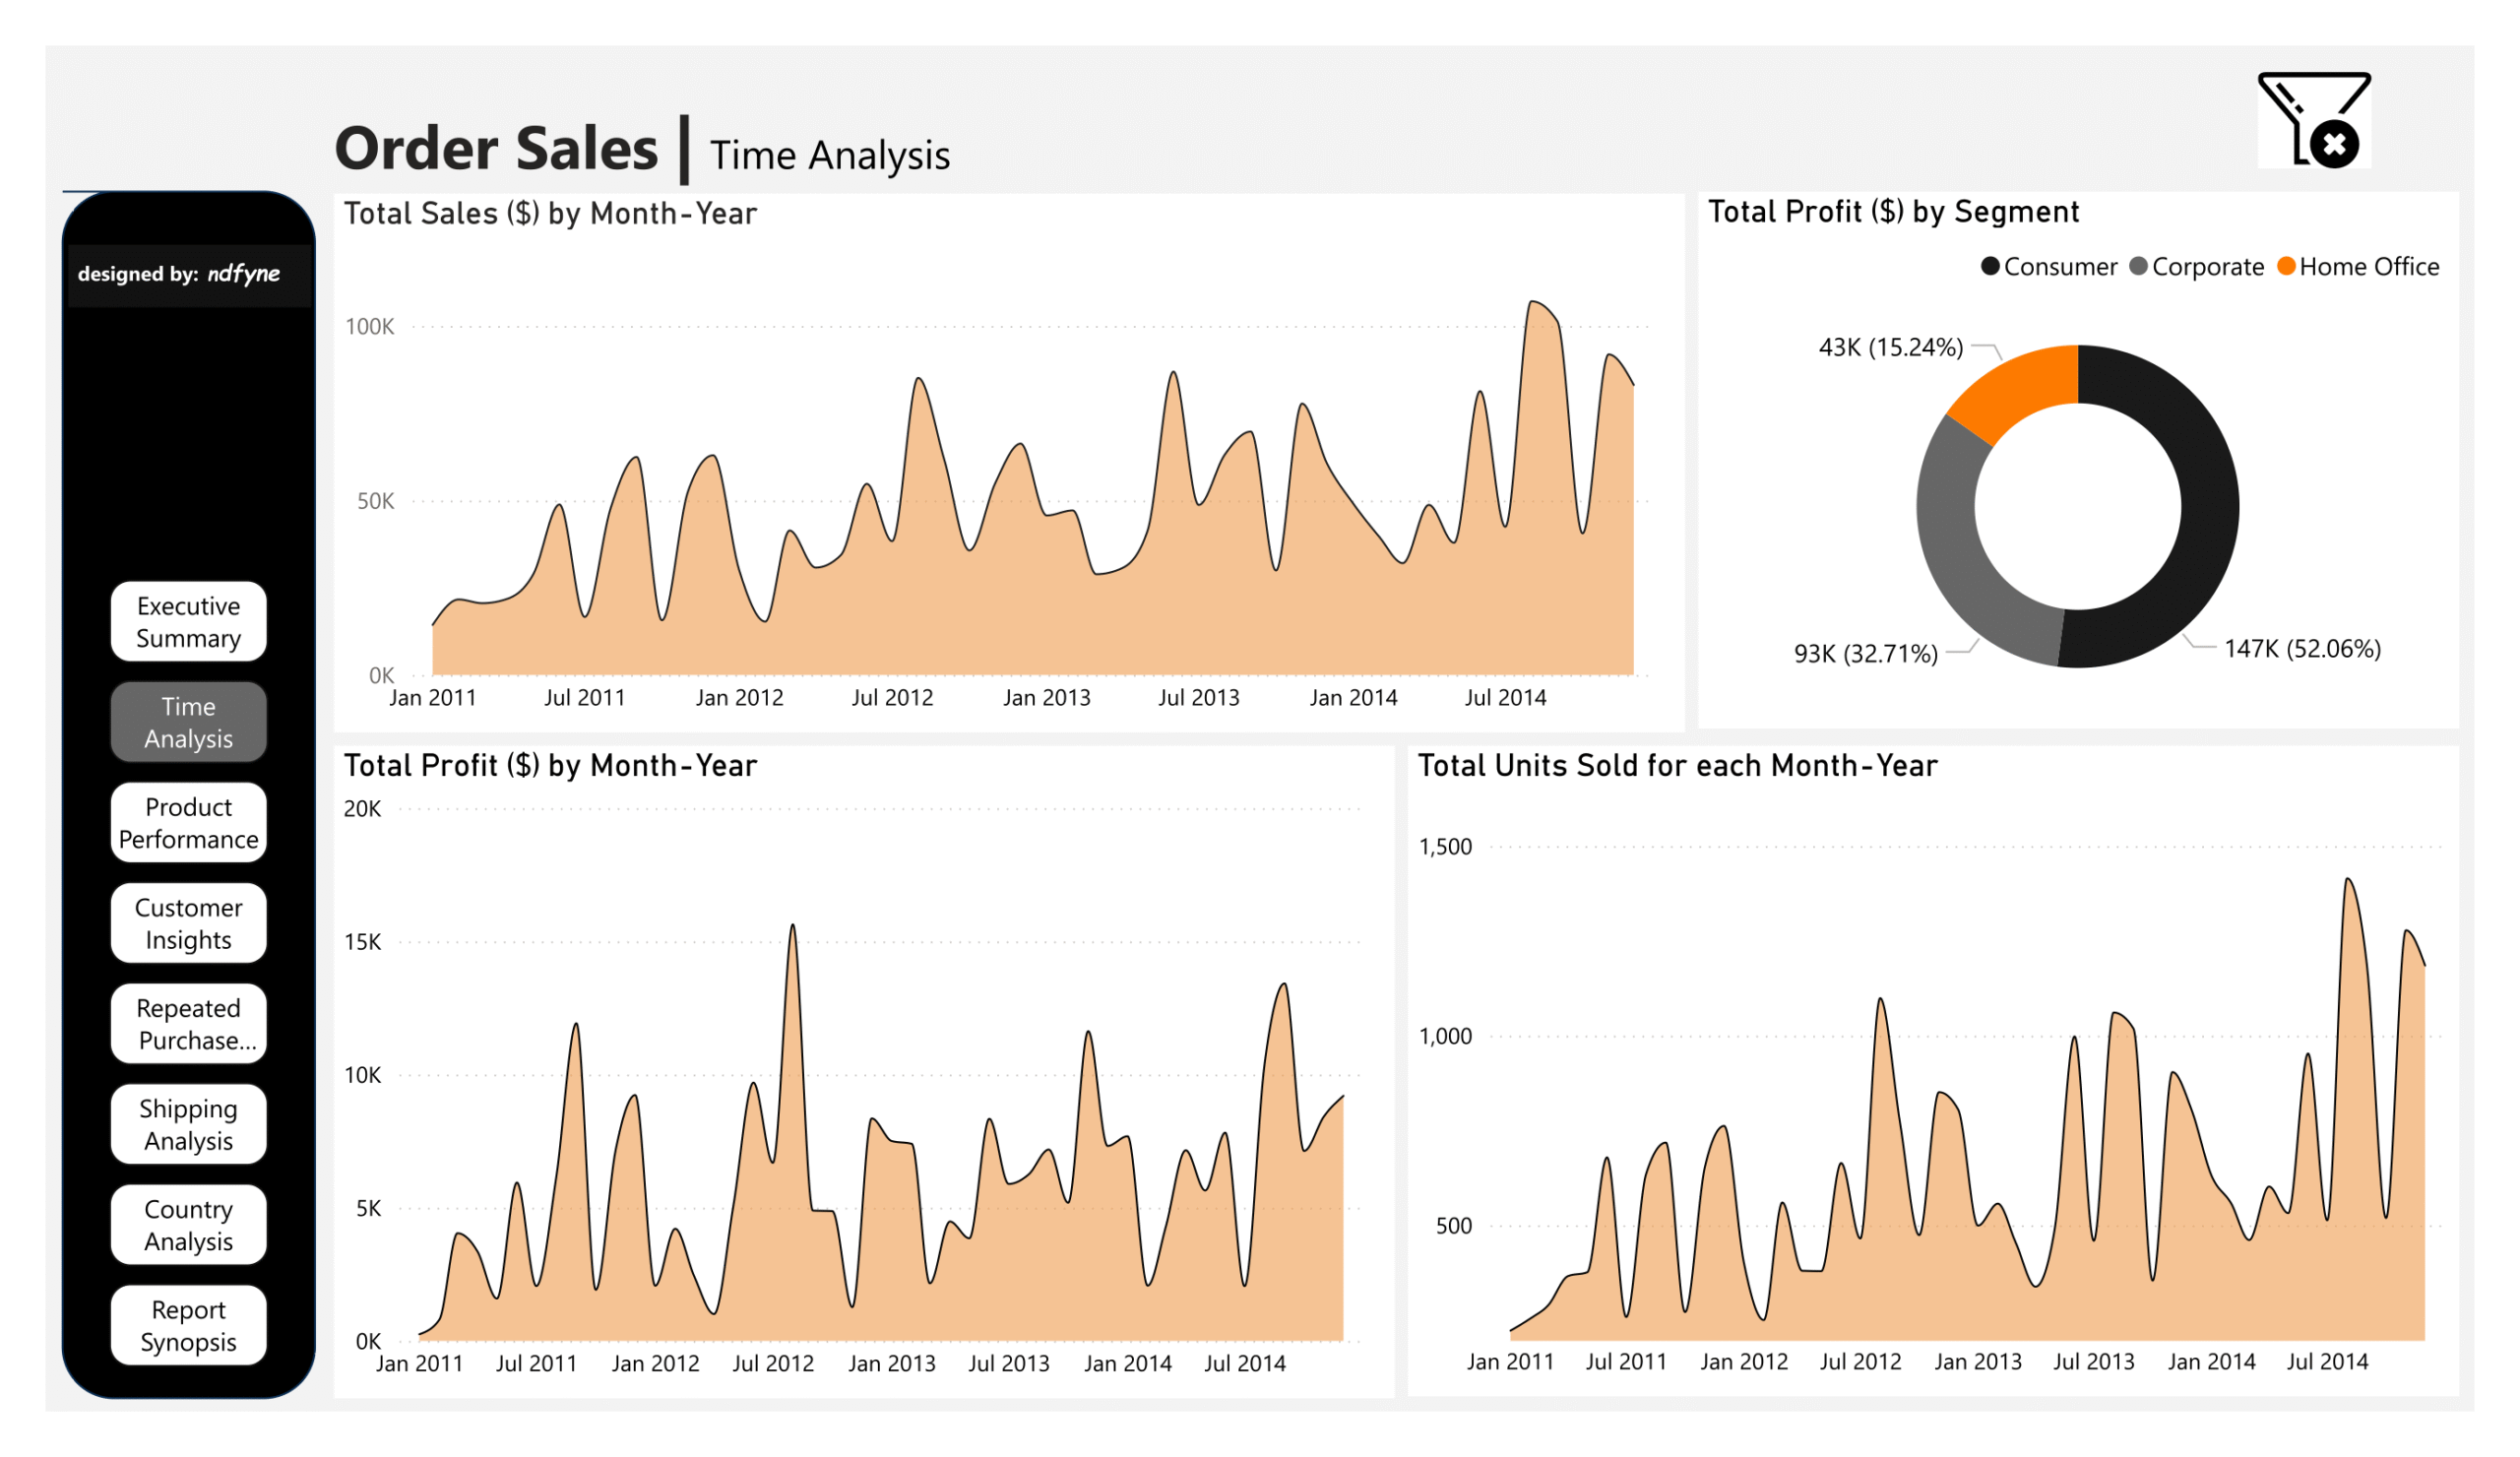
- Seasonality: Q3 consistently drove the highest sales each year, peaking in August 2014.
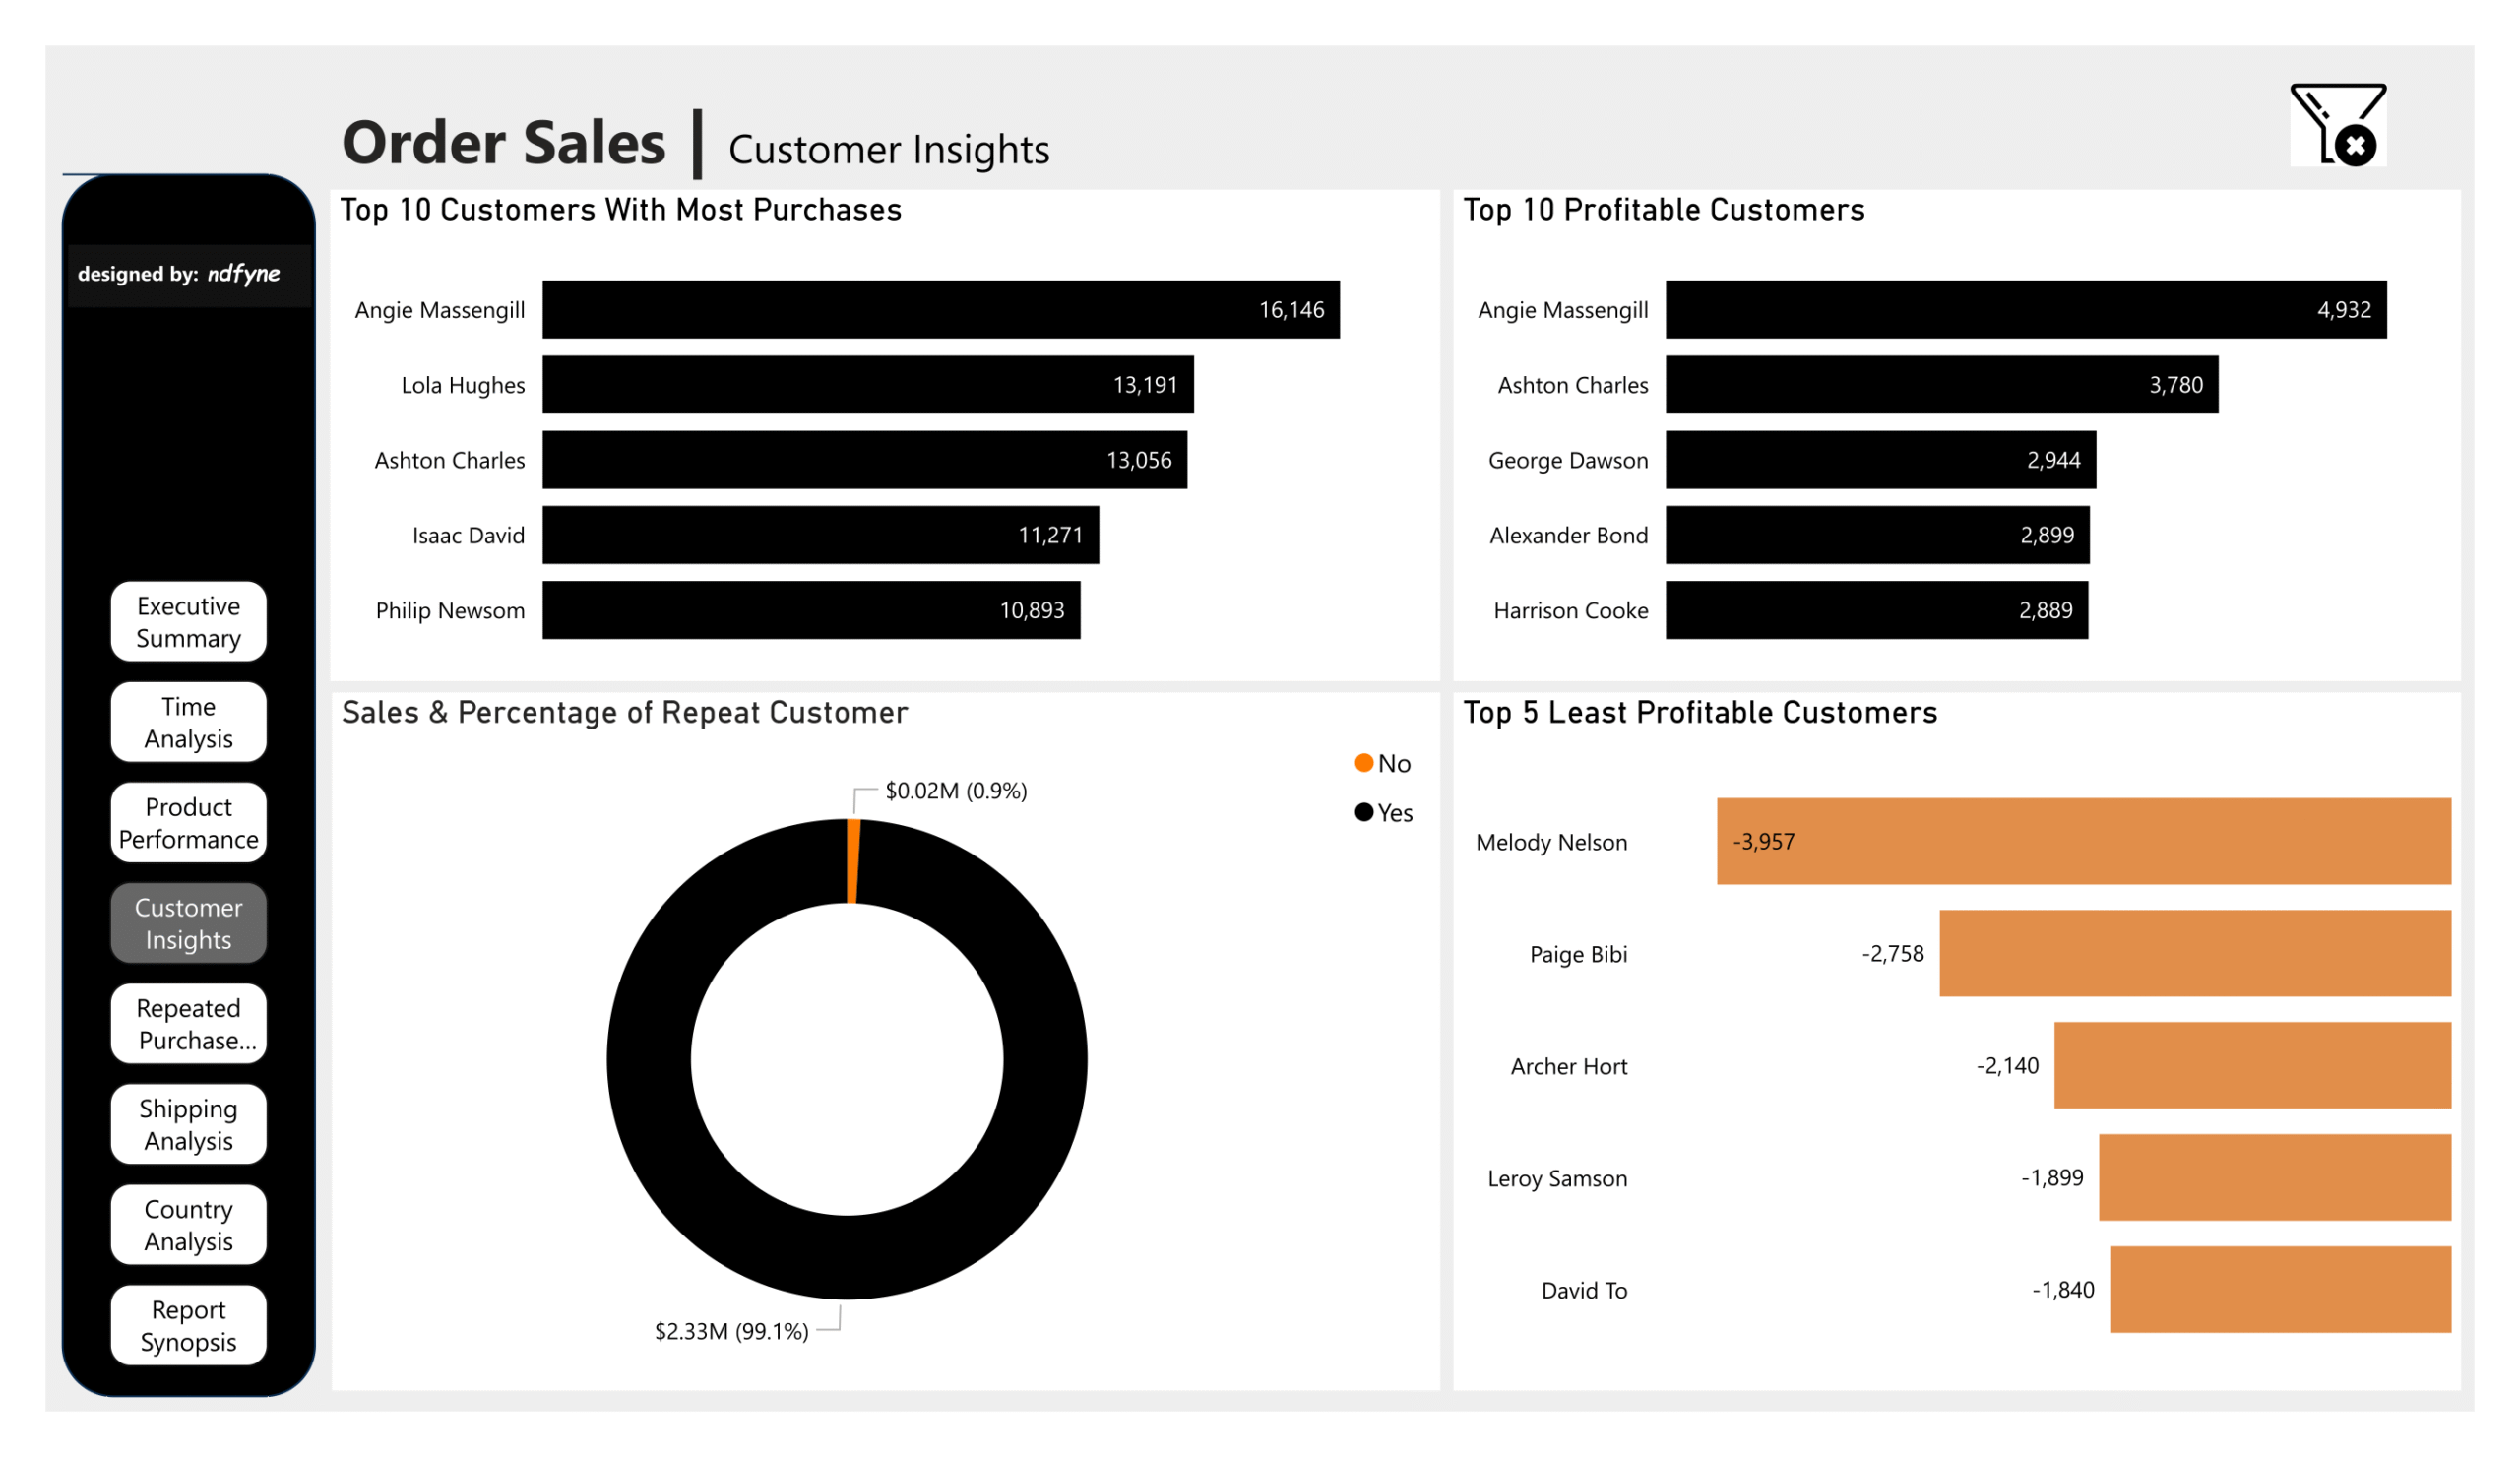
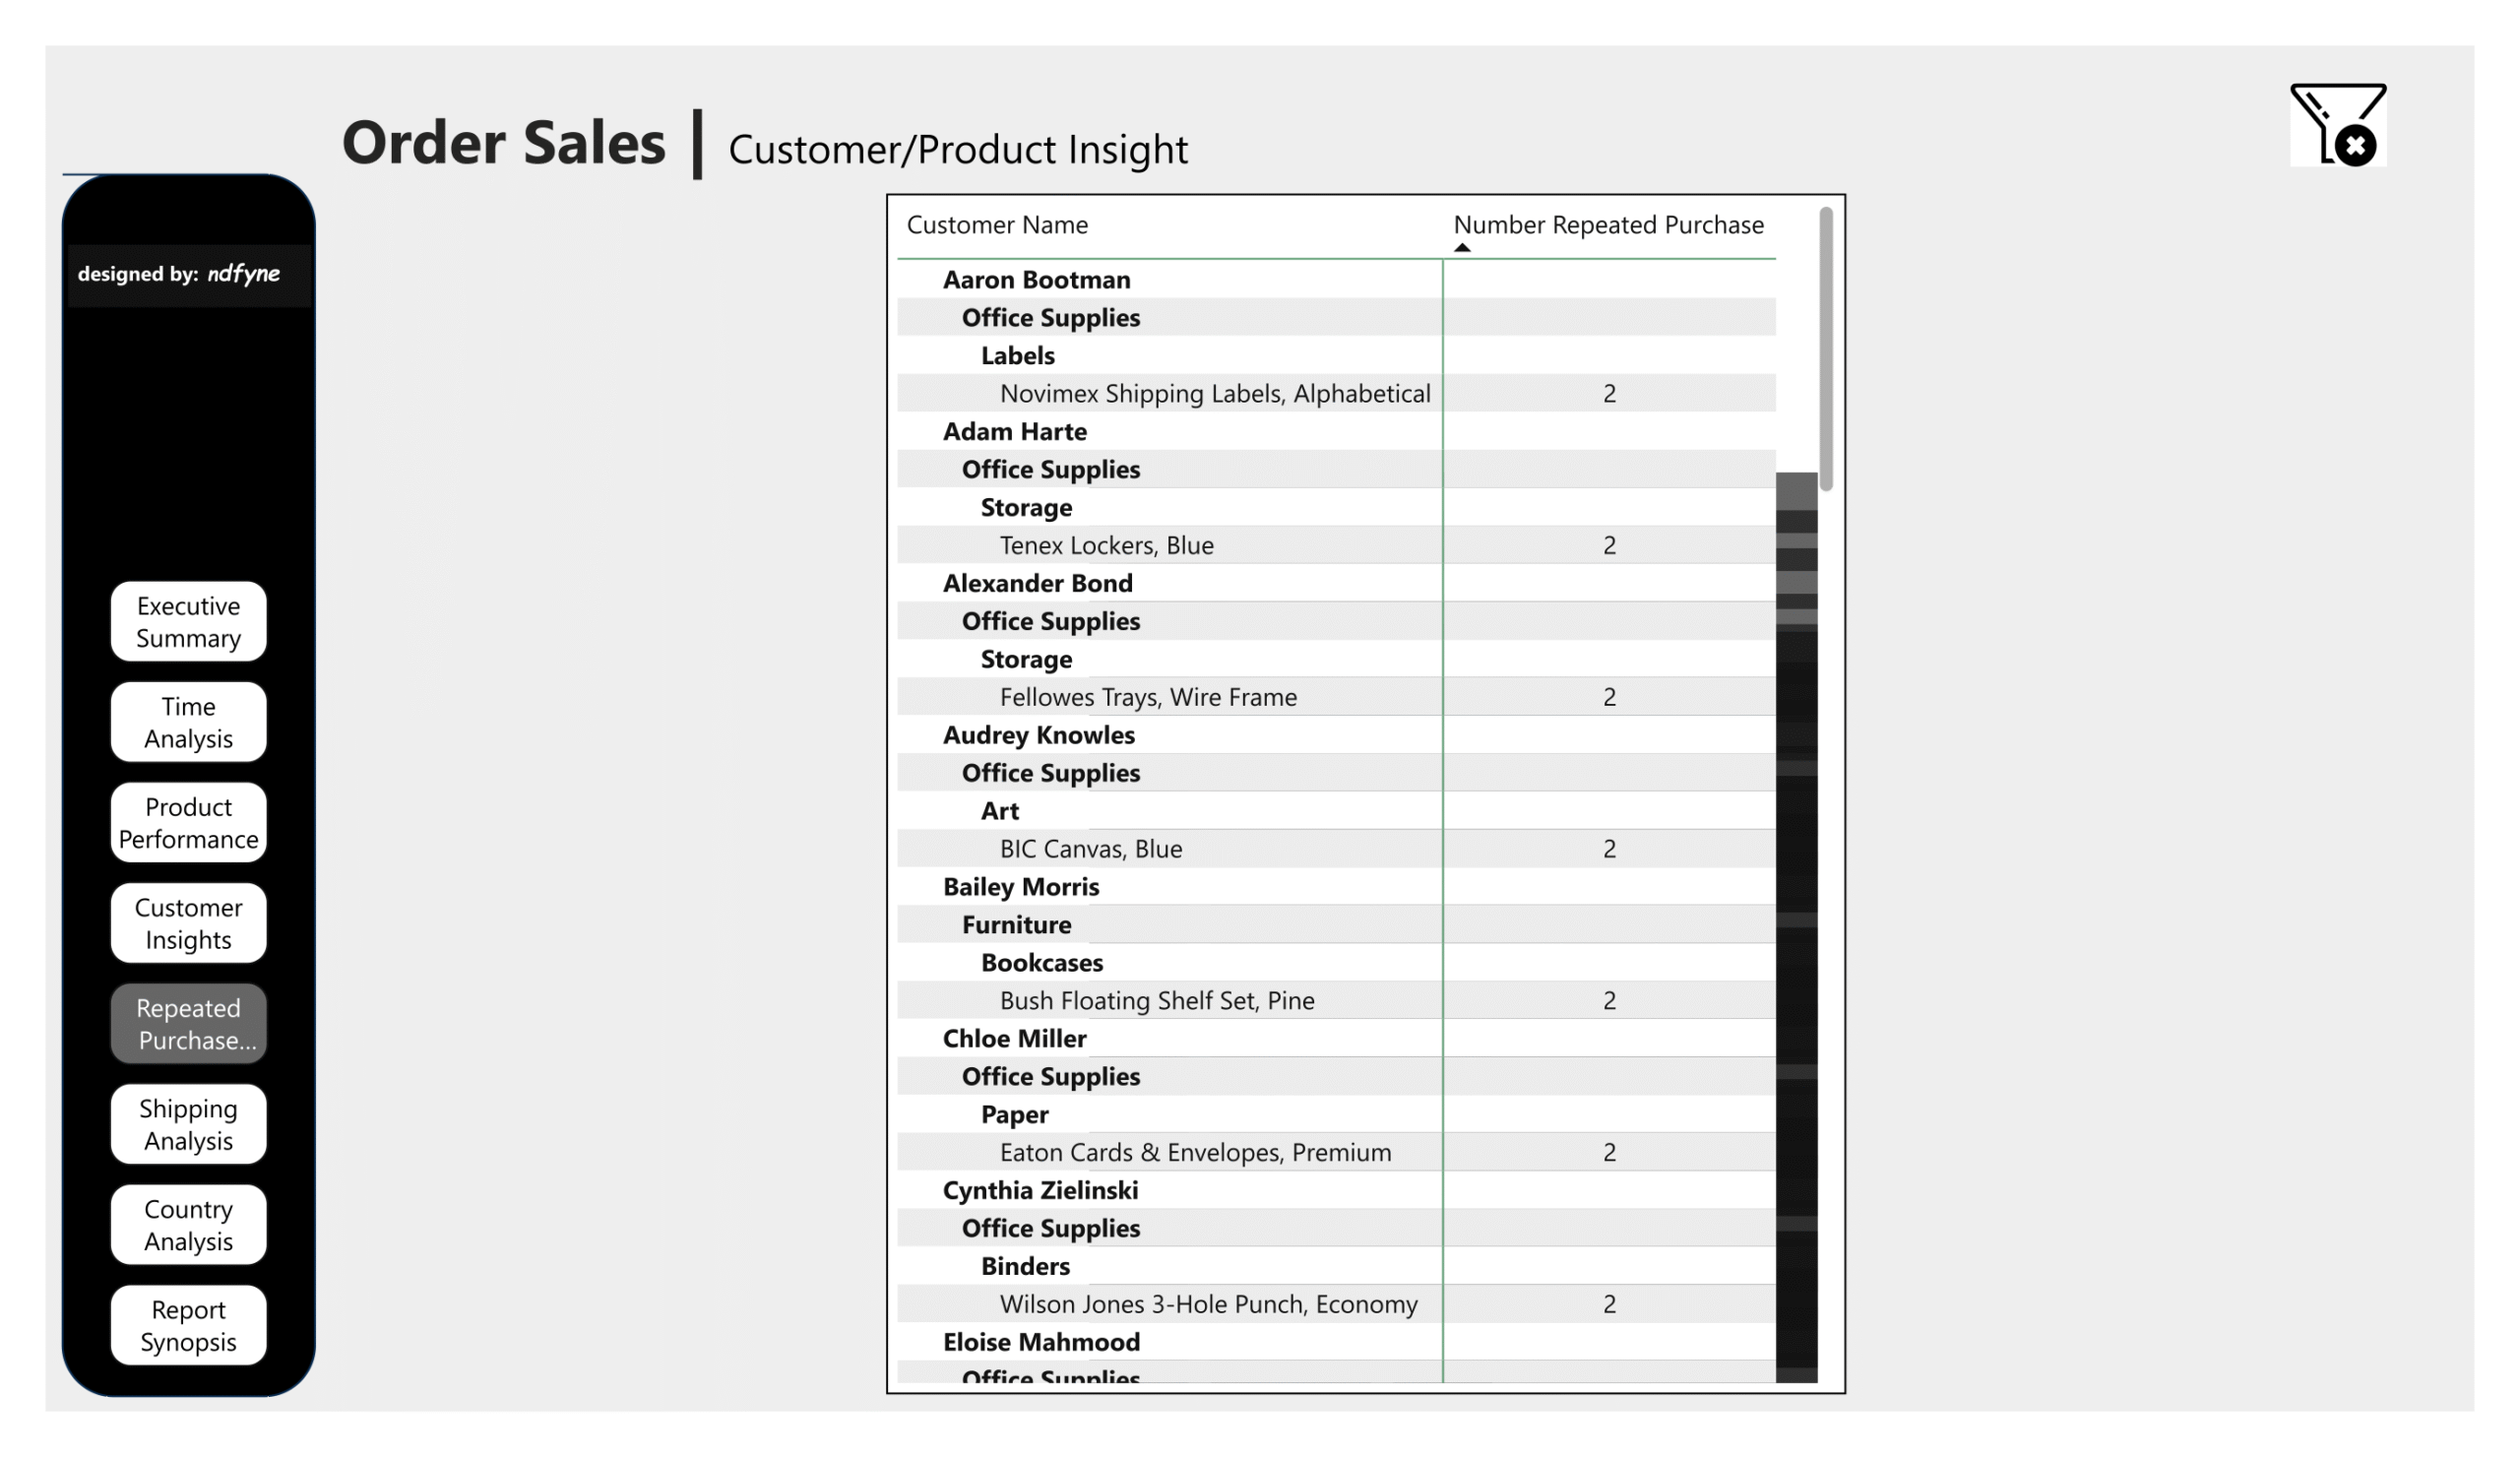
- Customer Behavior: Over 99% of purchases were from one-time buyers, but select customers
like Angie Massengill and Ashton Charles were both top buyers and most profitable. - Geography: The Central region (Germany, France) delivered the most profit; Netherlands had a
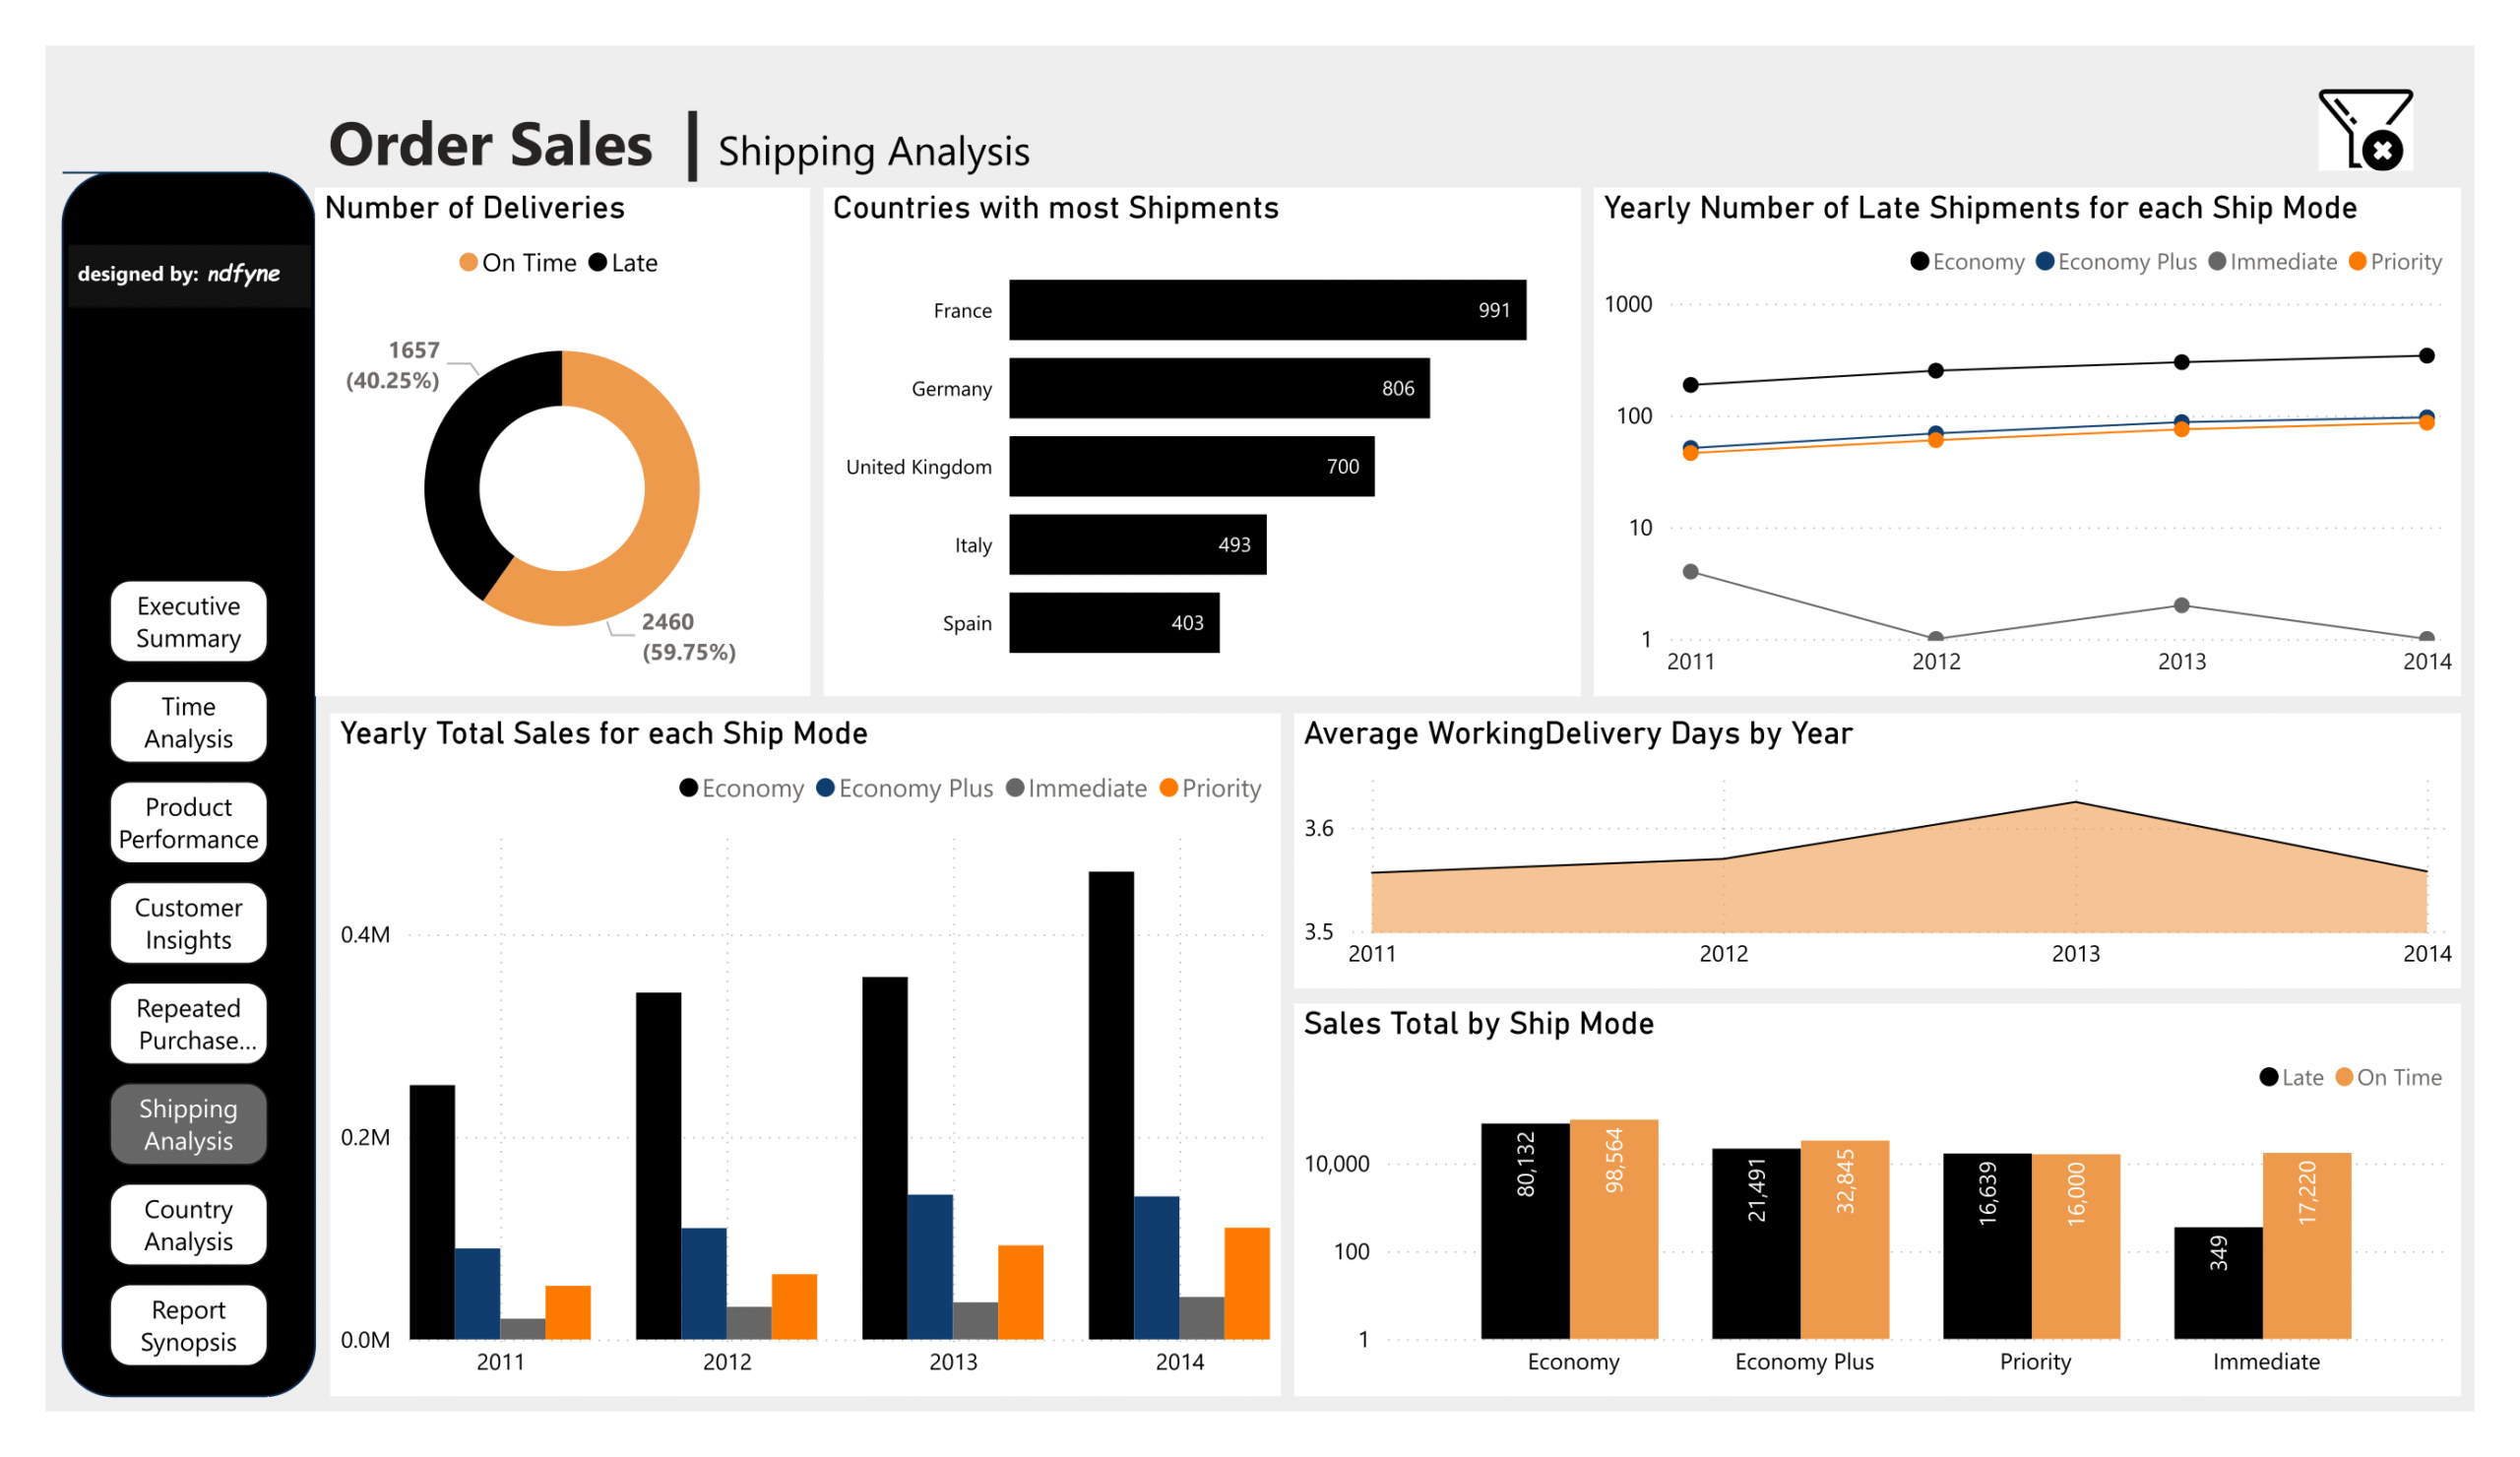
significant loss of $37K. - Shipping: Over 40% of shipments were late, indicating poor logistics performance.
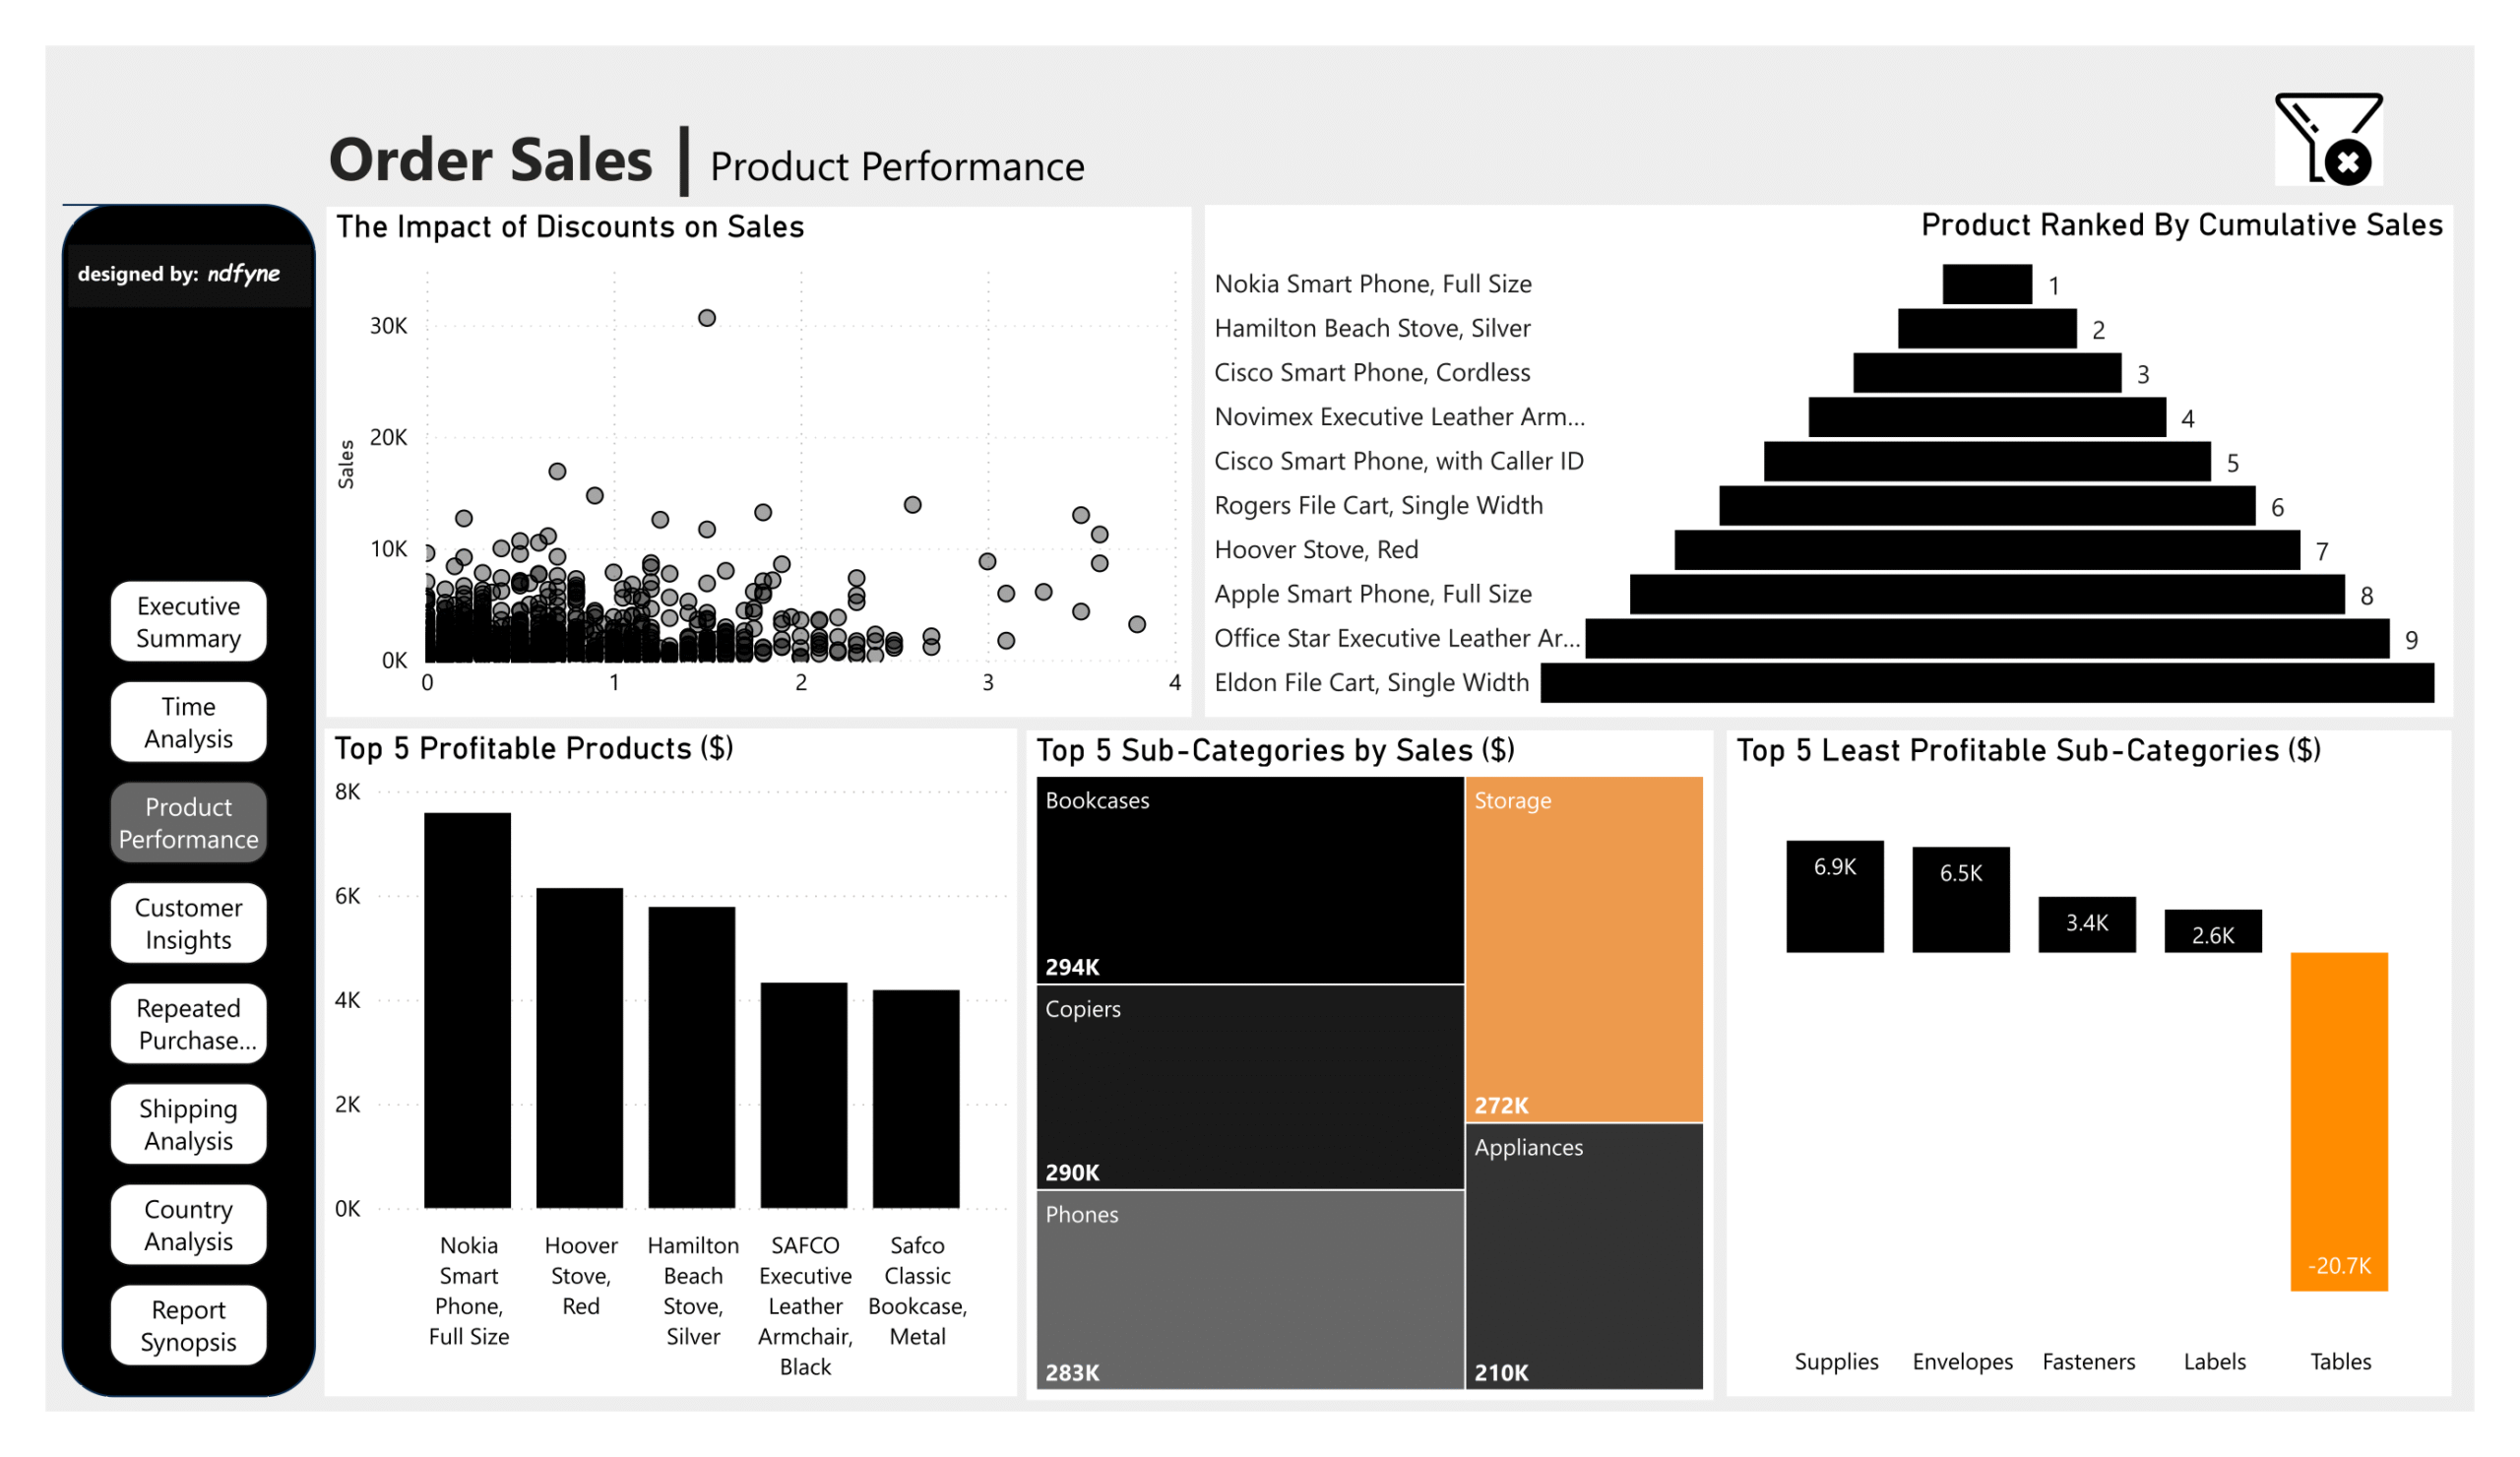
- Discounts: No correlation between discounts and increased sales was found — highlighting an
opportunity to rethink the discount strategy.
Recommendations:
- Expand in Low-Performing Regions (e.g., North region & Netherlands) with localized promotions
and distributor partnerships. - Capitalize on Q3 Trends by launching campaigns and new products in Q2 to build momentum.
- Reframe Discount Strategy — shift from flat discounts to targeted offers (bundles, loyalty perks,
free shipping) to protect profit margins. - Audit Shipping Carriers and track delays by mode using Power BI alerts. Apply incentives for
timely deliveries. - Segment and Target Profitable Customers through loyalty programs and value-tiered offers,
while reassessing unprofitable accounts.
🛠️ Tools & Features:
- Power BI: KPIs, DAX measures (e.g., cumulative sales, working days, profit margin)
- Drill-down
- Dynamic titles for user-friendly storytelling
- Bookmarks
- Filter Panels
- Slicers